In this article we explain you how to create a new bar chart widget from scratch.
To create a new KPI widget you first:
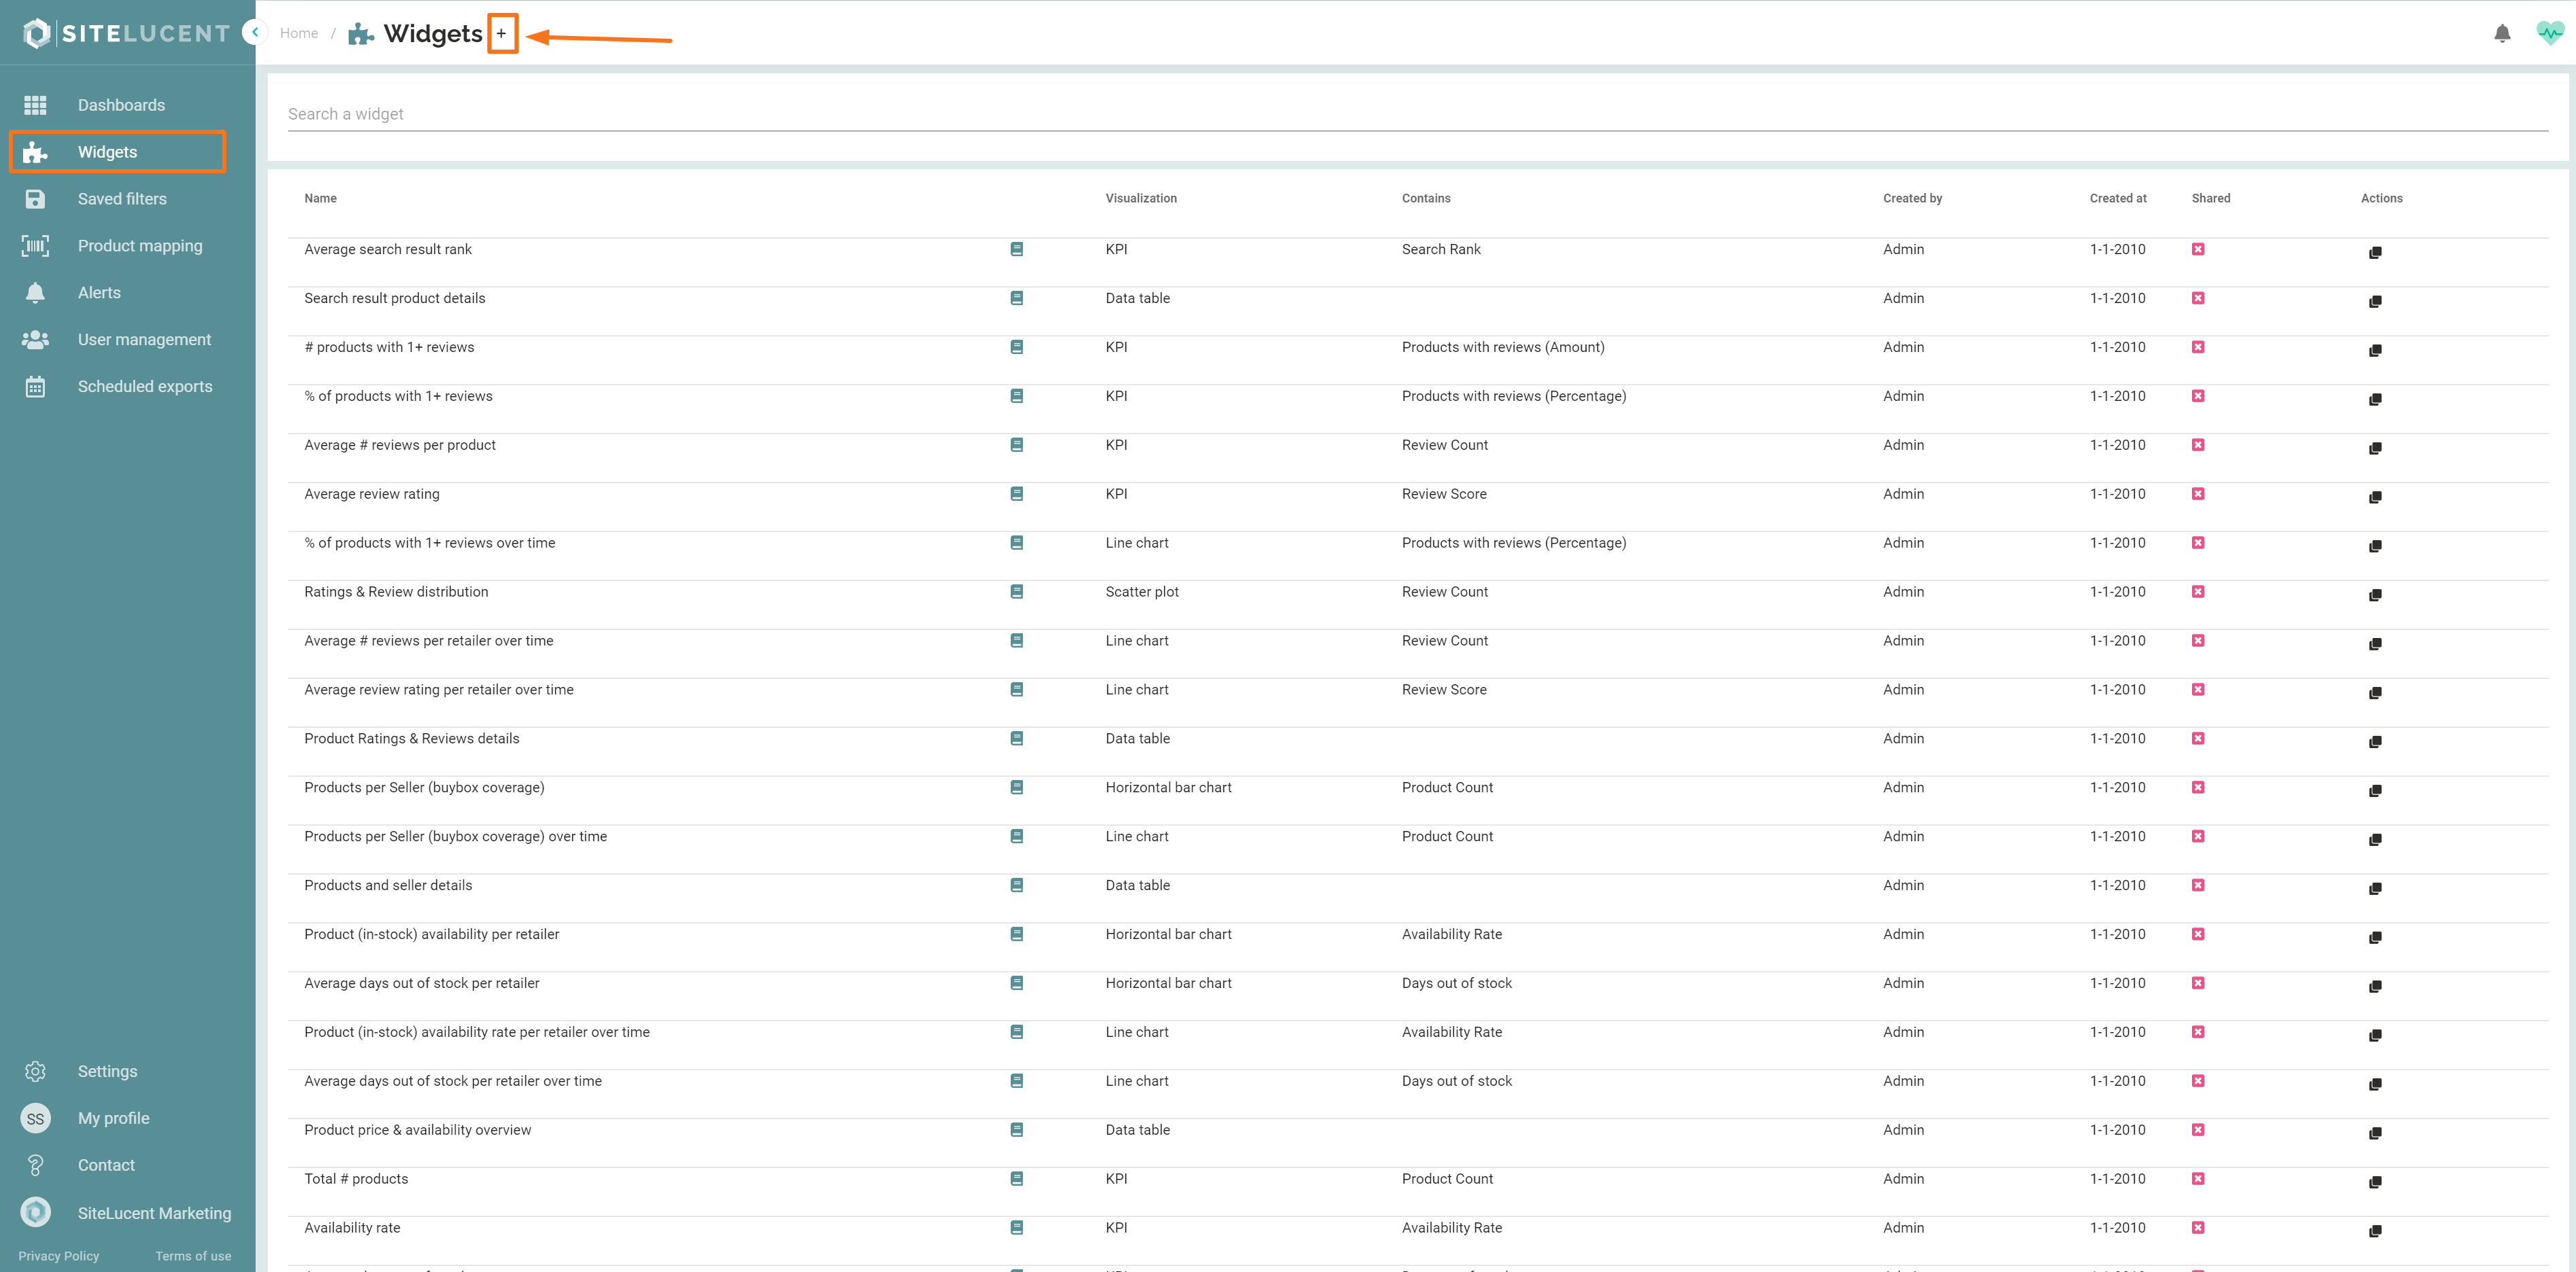
- Navigate to the widgets section
 in the left menu
 - Then click the " + " right next to "Widgets"
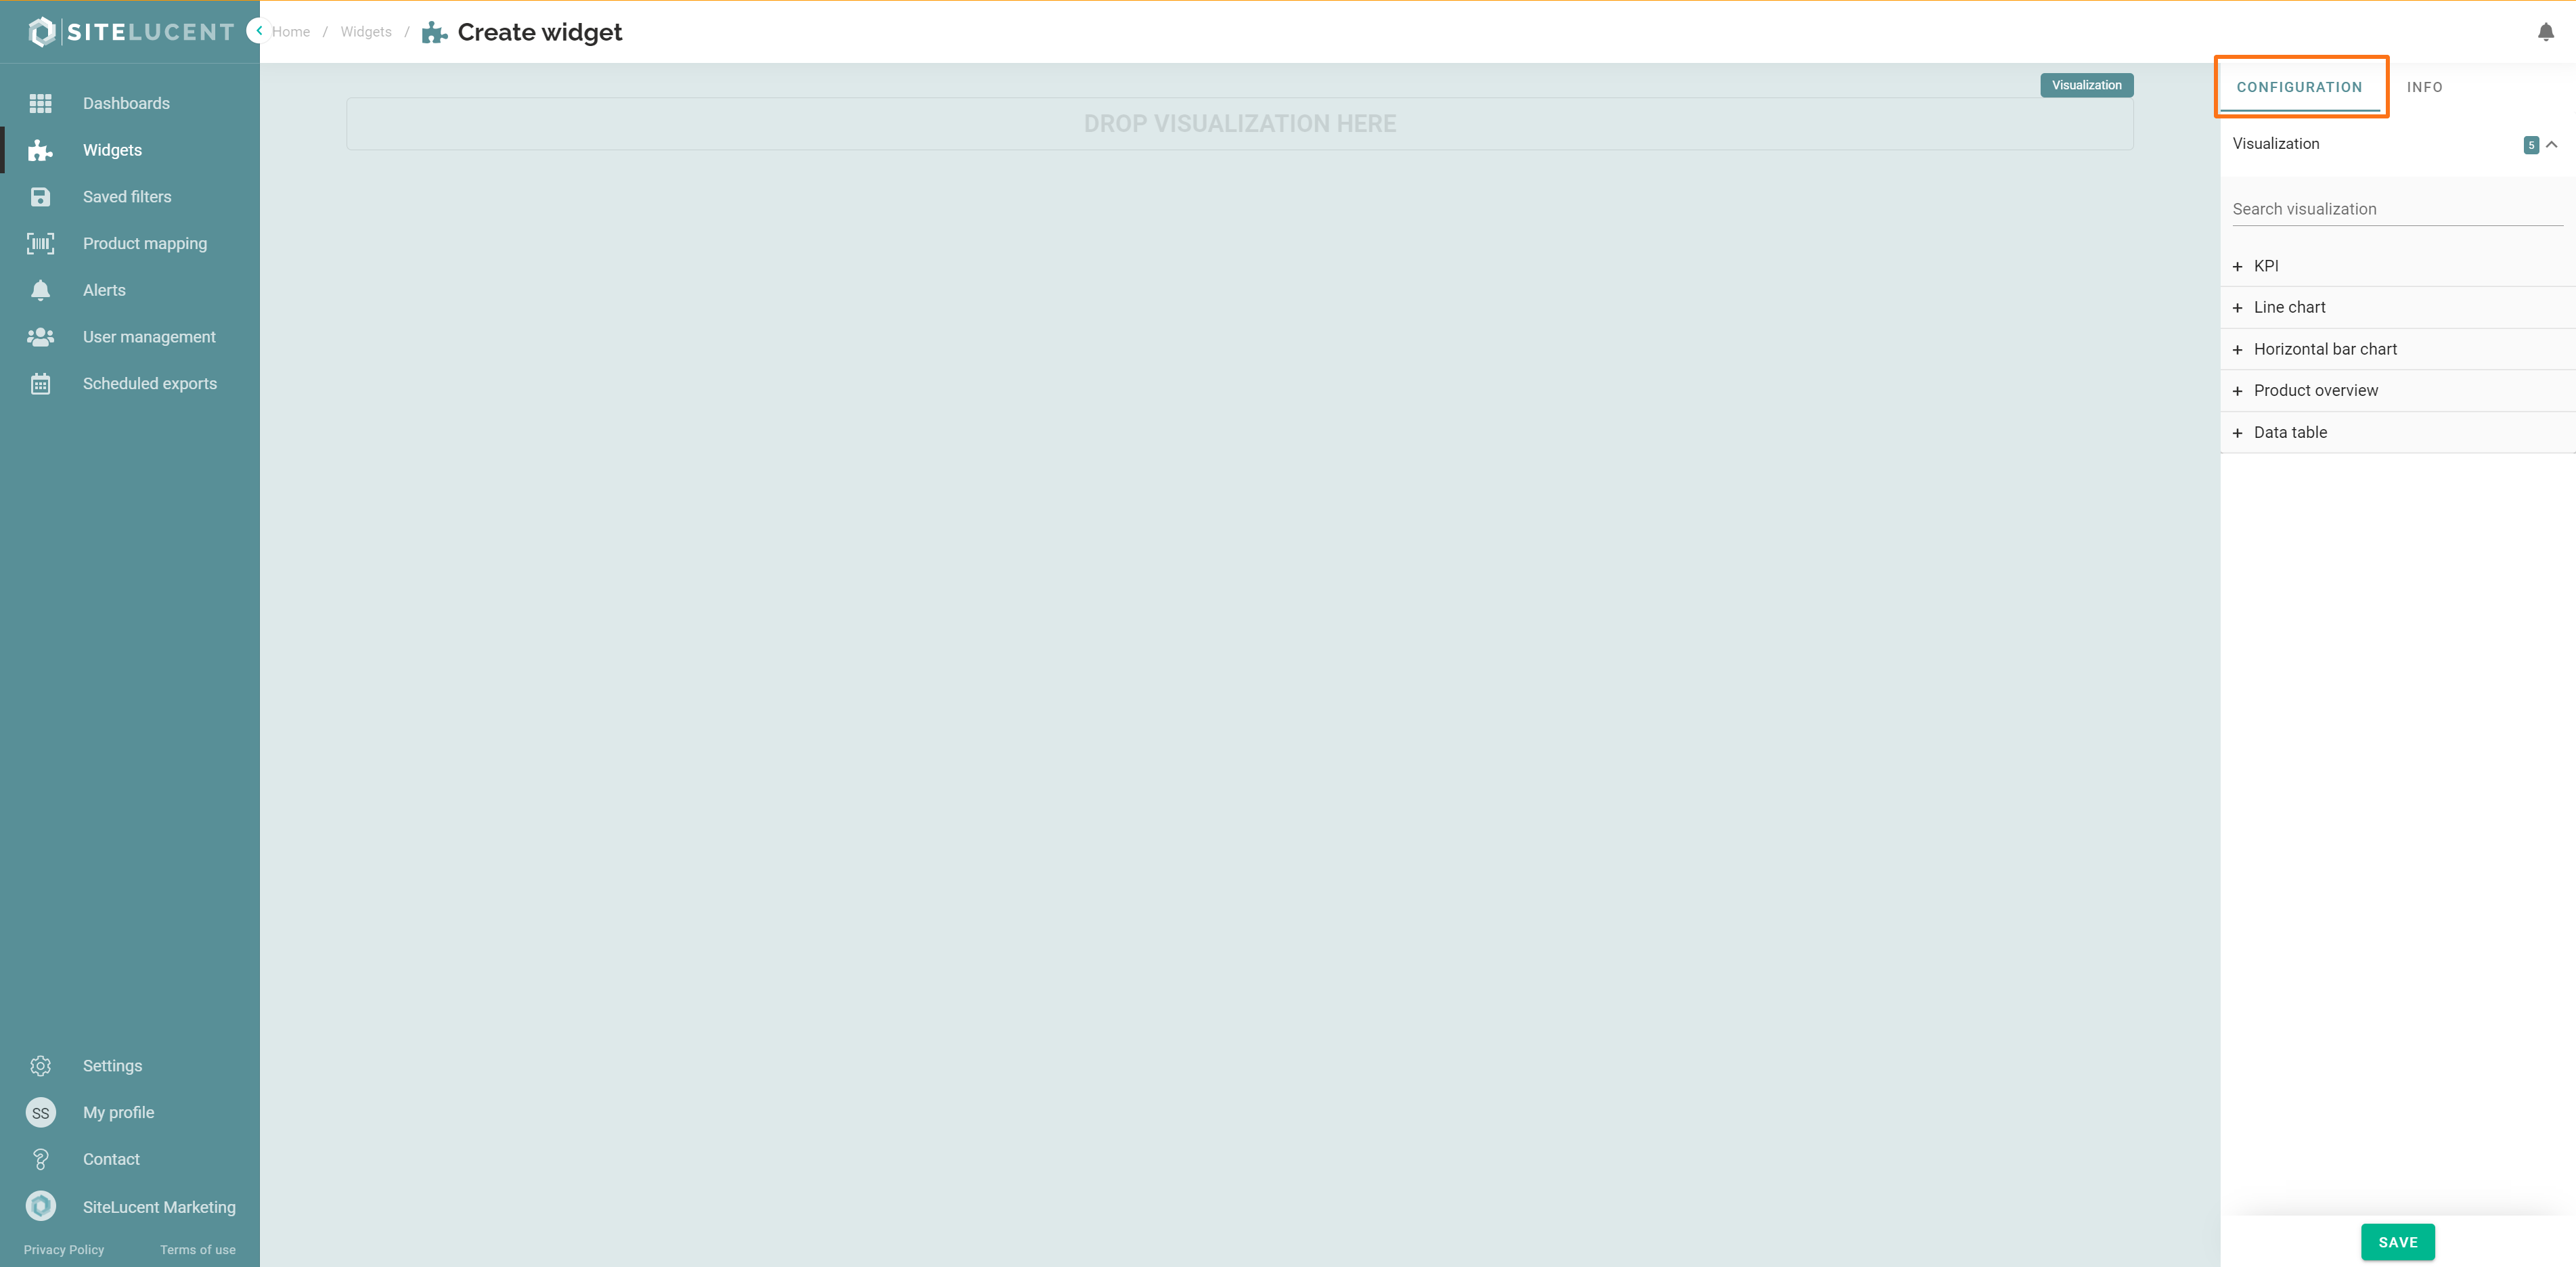
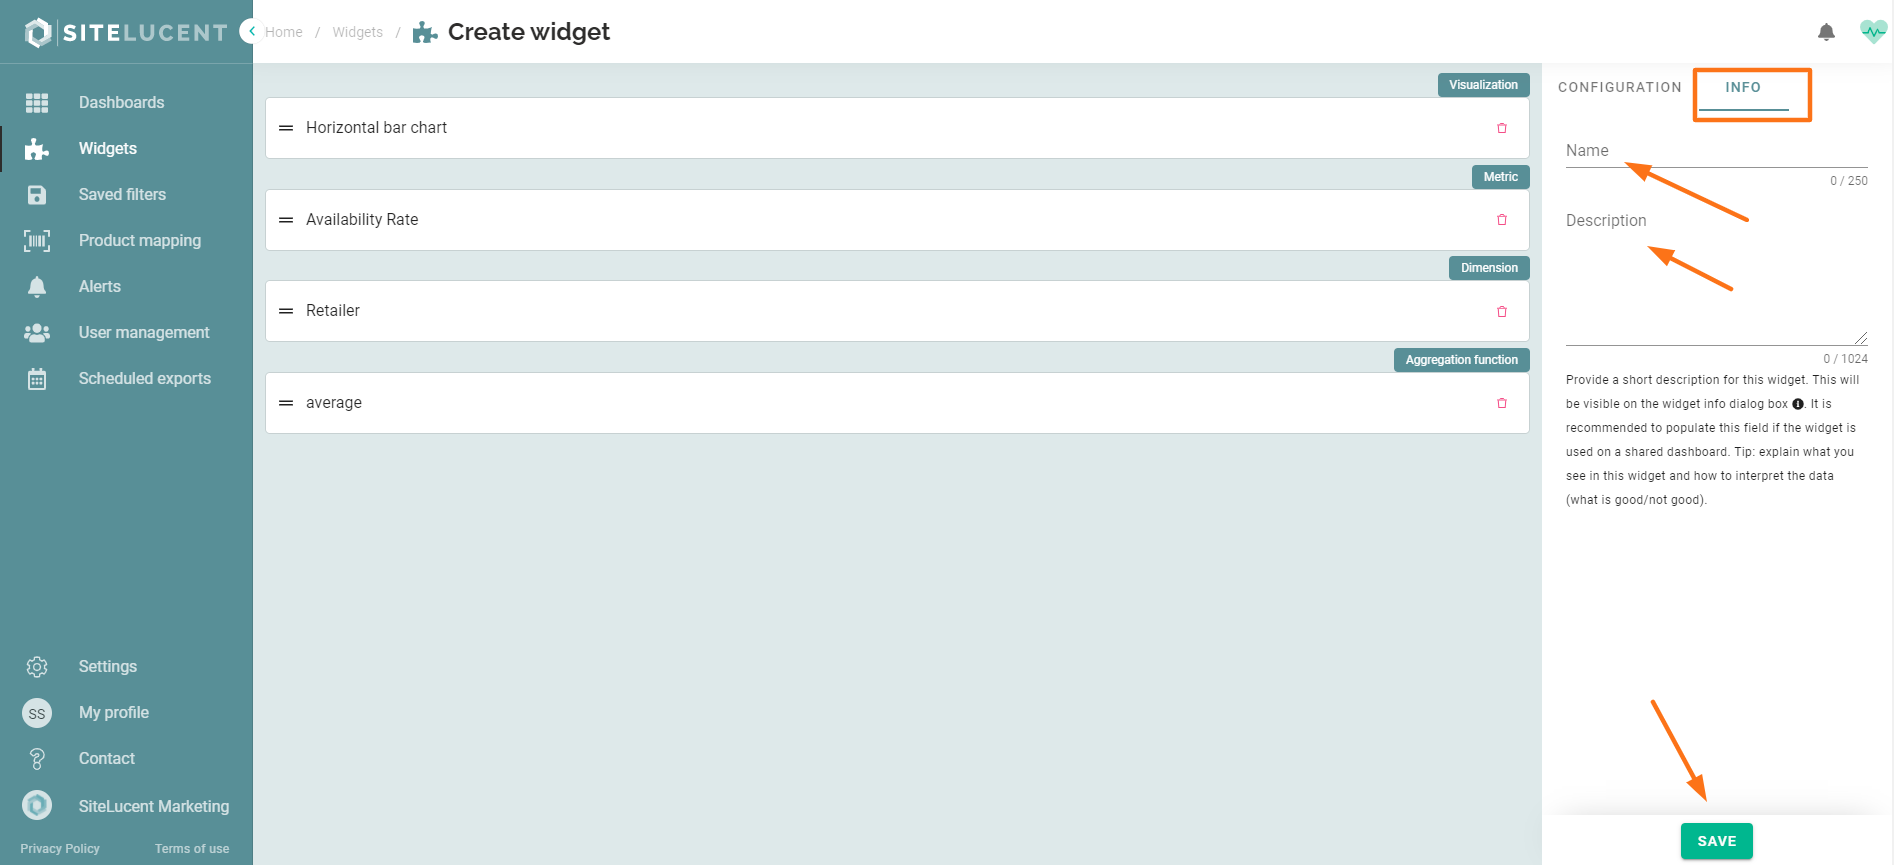
In the "Configuration" tab on the right side of your screen, you first:
- Choose visualization type "Horizontal bar chart": The bar chart widget shows bars with lengths proportional to the values that they represent. Bar charts make it easy to compare data and see how they relate to each other.
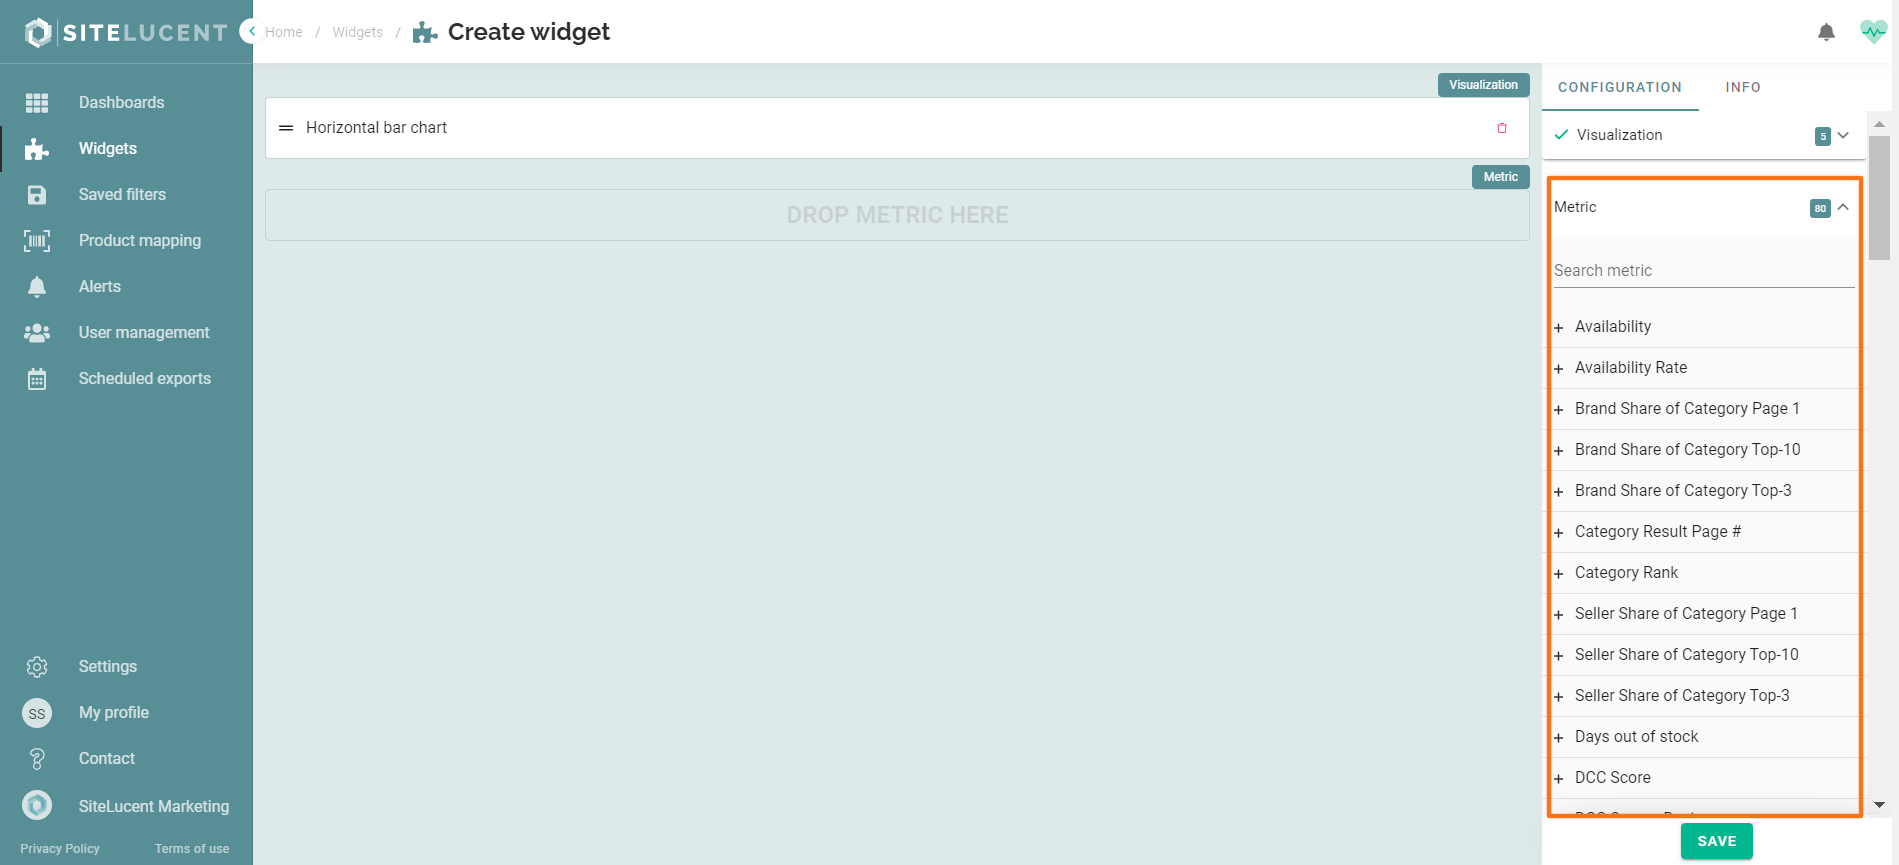
- Select 1 metric.
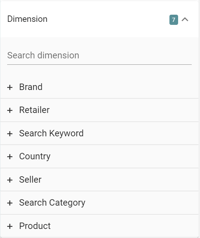
- Then choose and select the dimension.
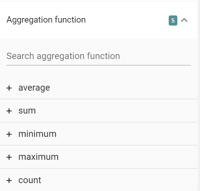
- Then choose and select the aggregation function.
- Open the "INFO" tab to add a widget name and description.
- Click save.
You have now created a new widget. The next step will be to add the widget to a dashboard.