In this article we explain you how to create a new KPI widget from scratch.
To create a new KPI widget you first:
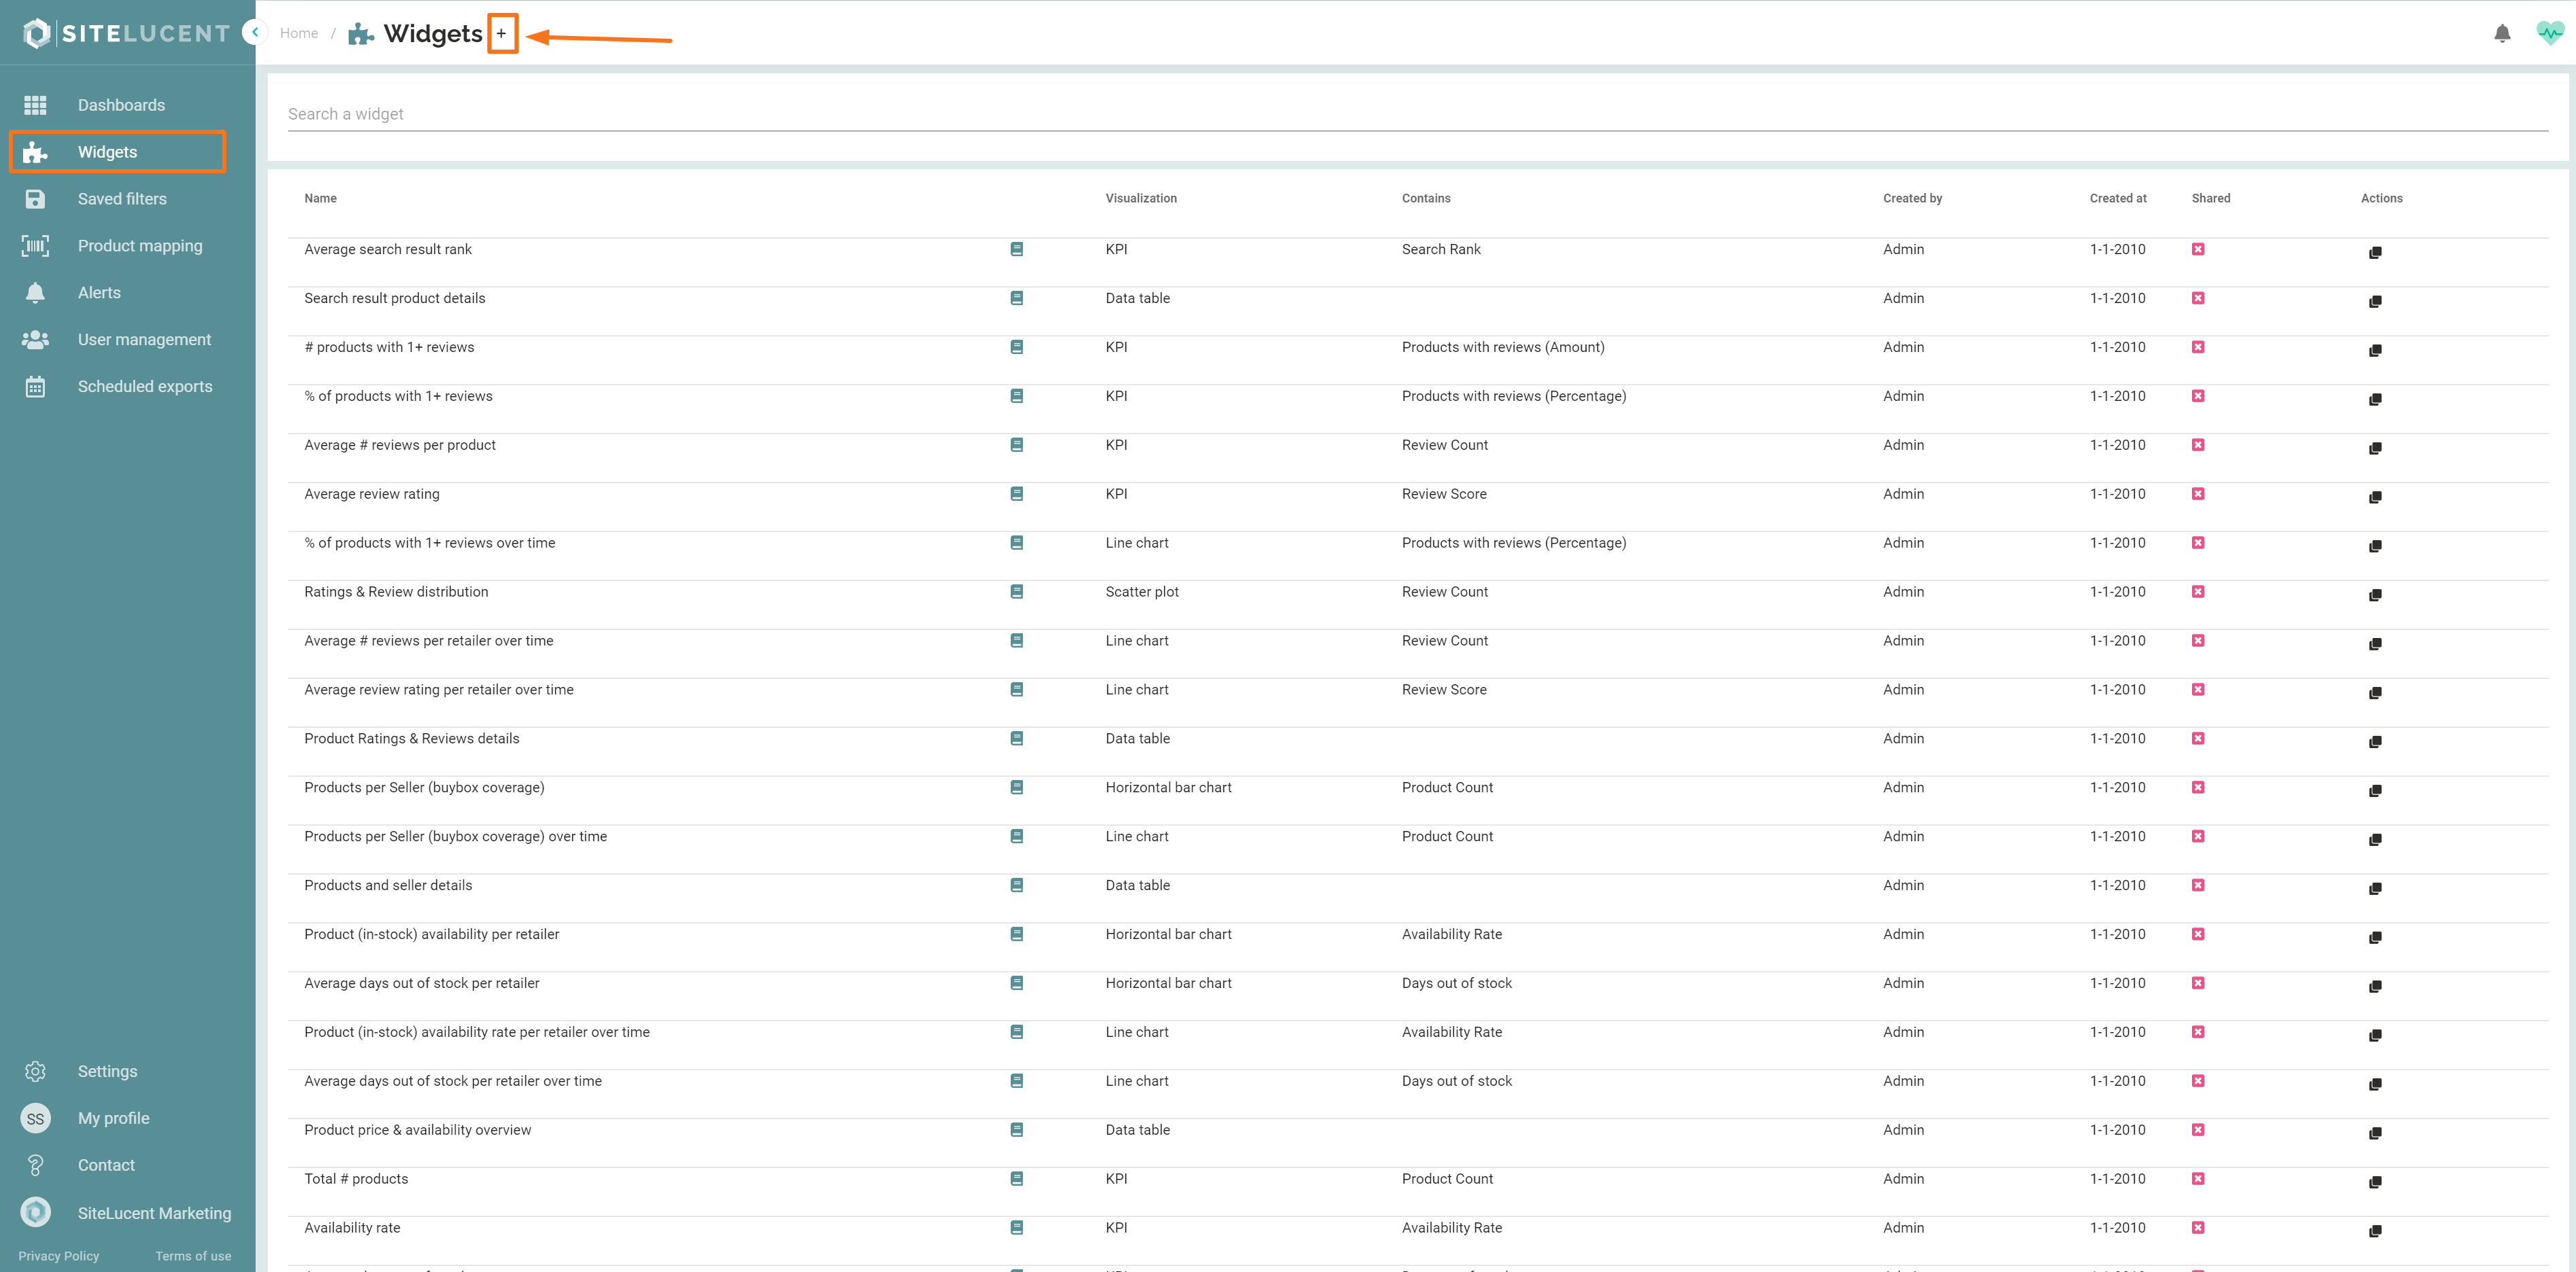
- Navigate to the widgets section
 in the left menu.
 - Then click the " + " right next to "Widgets".
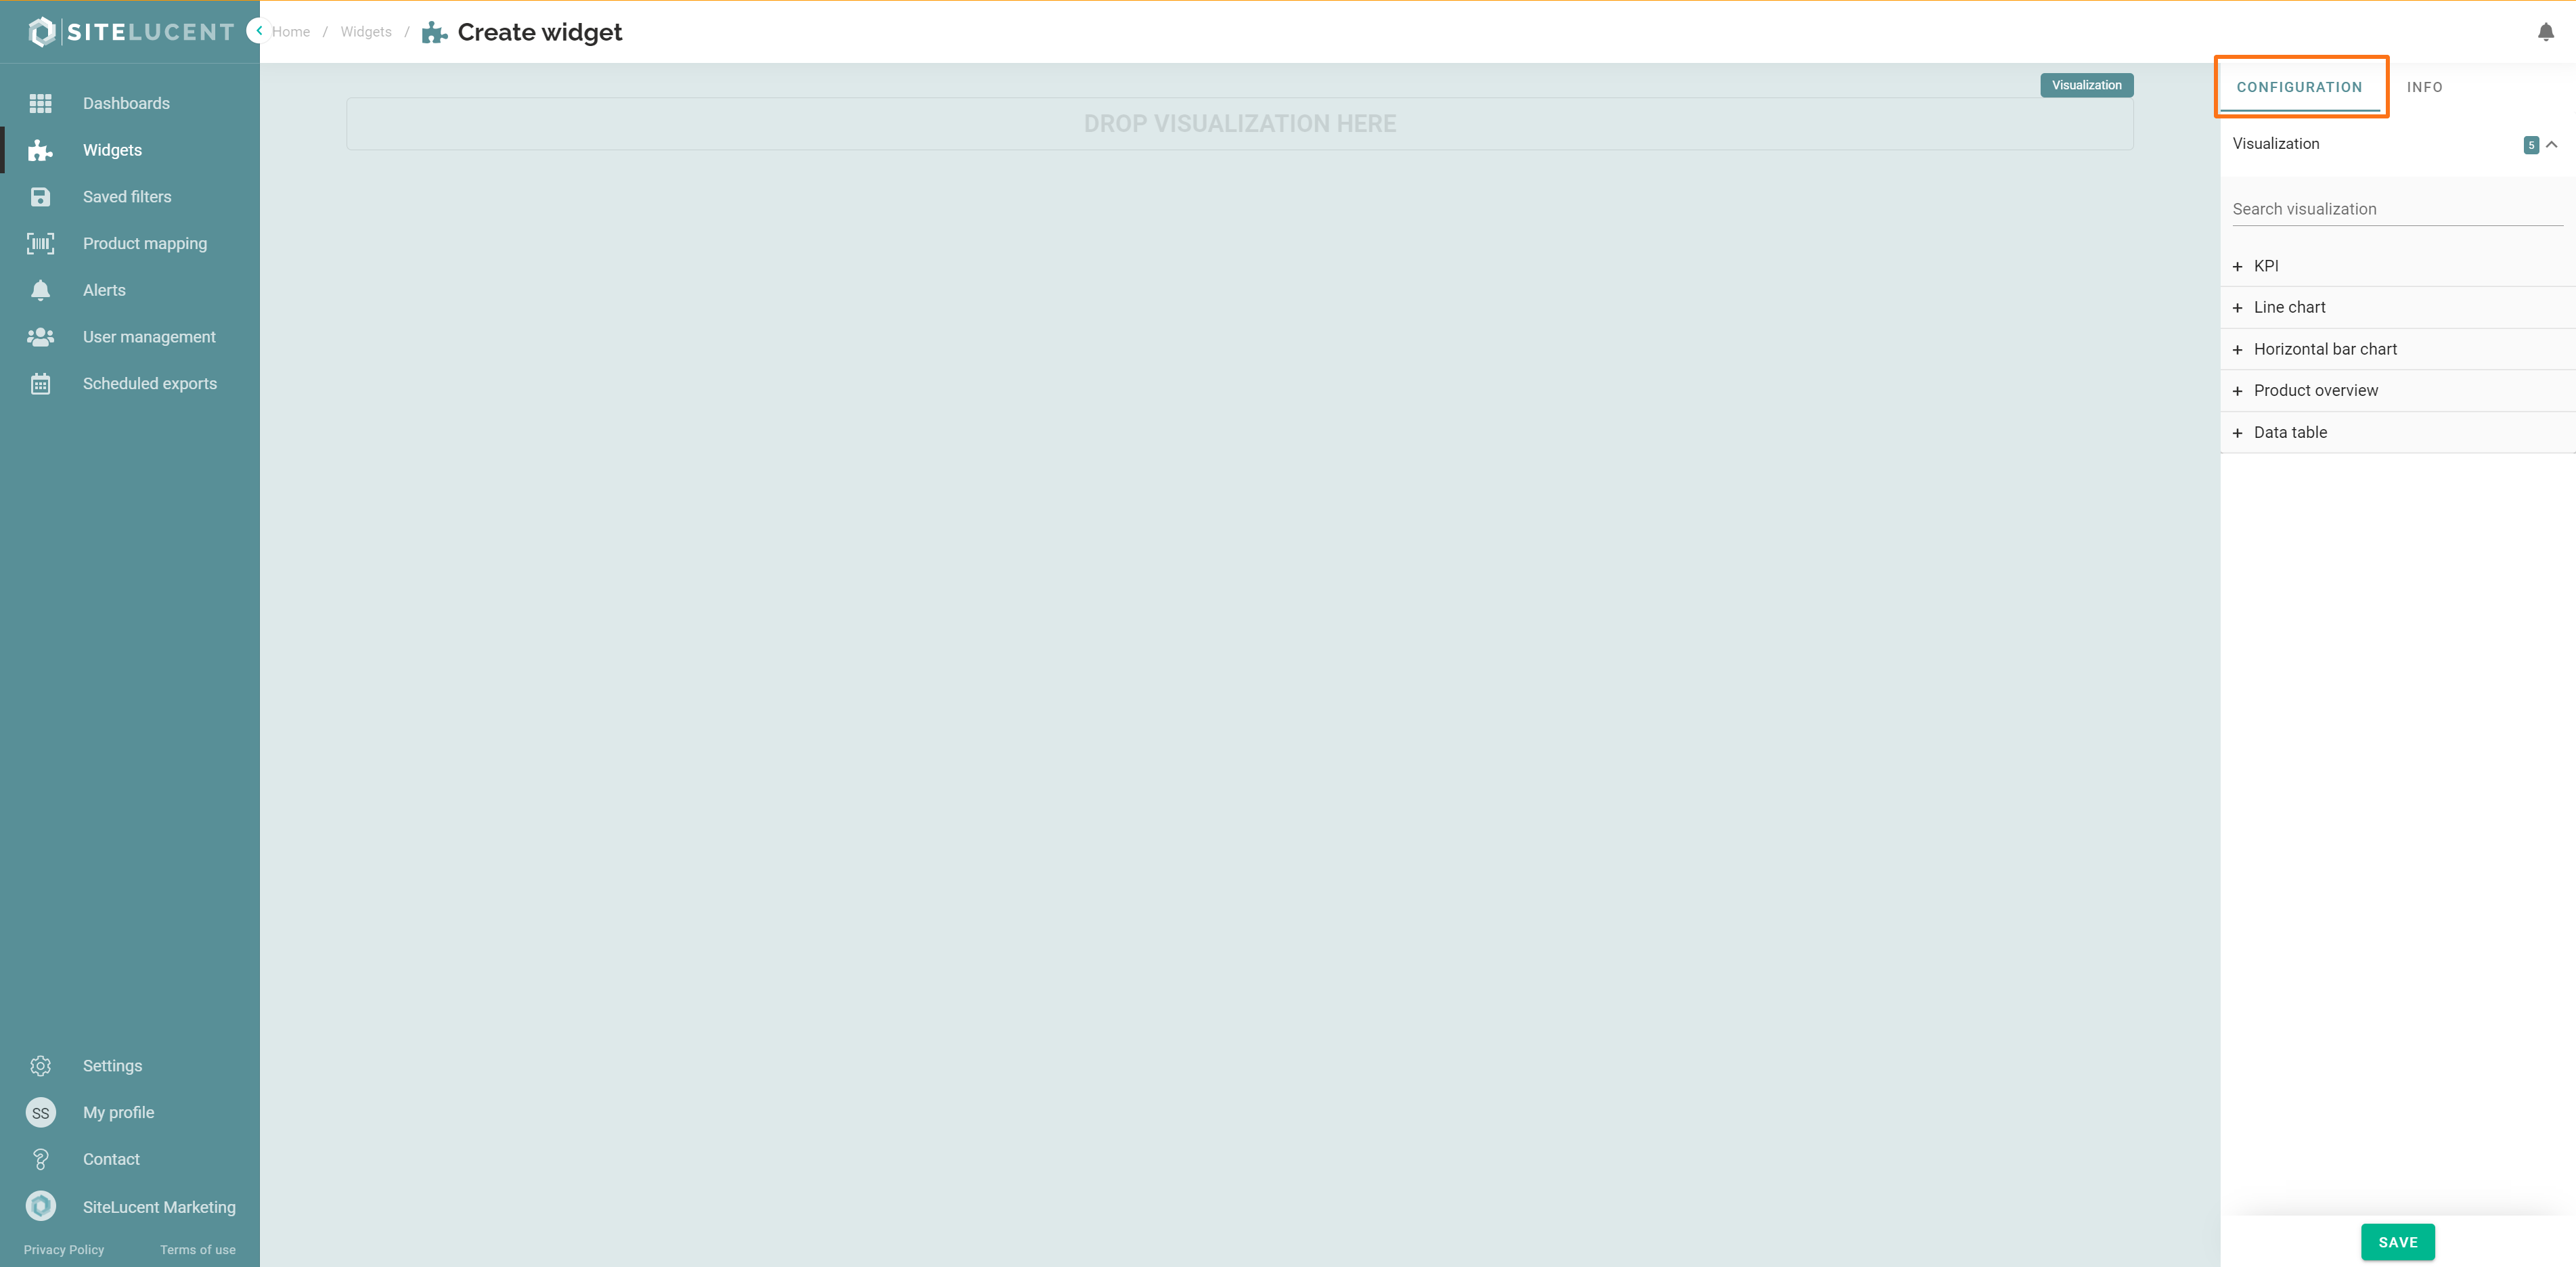
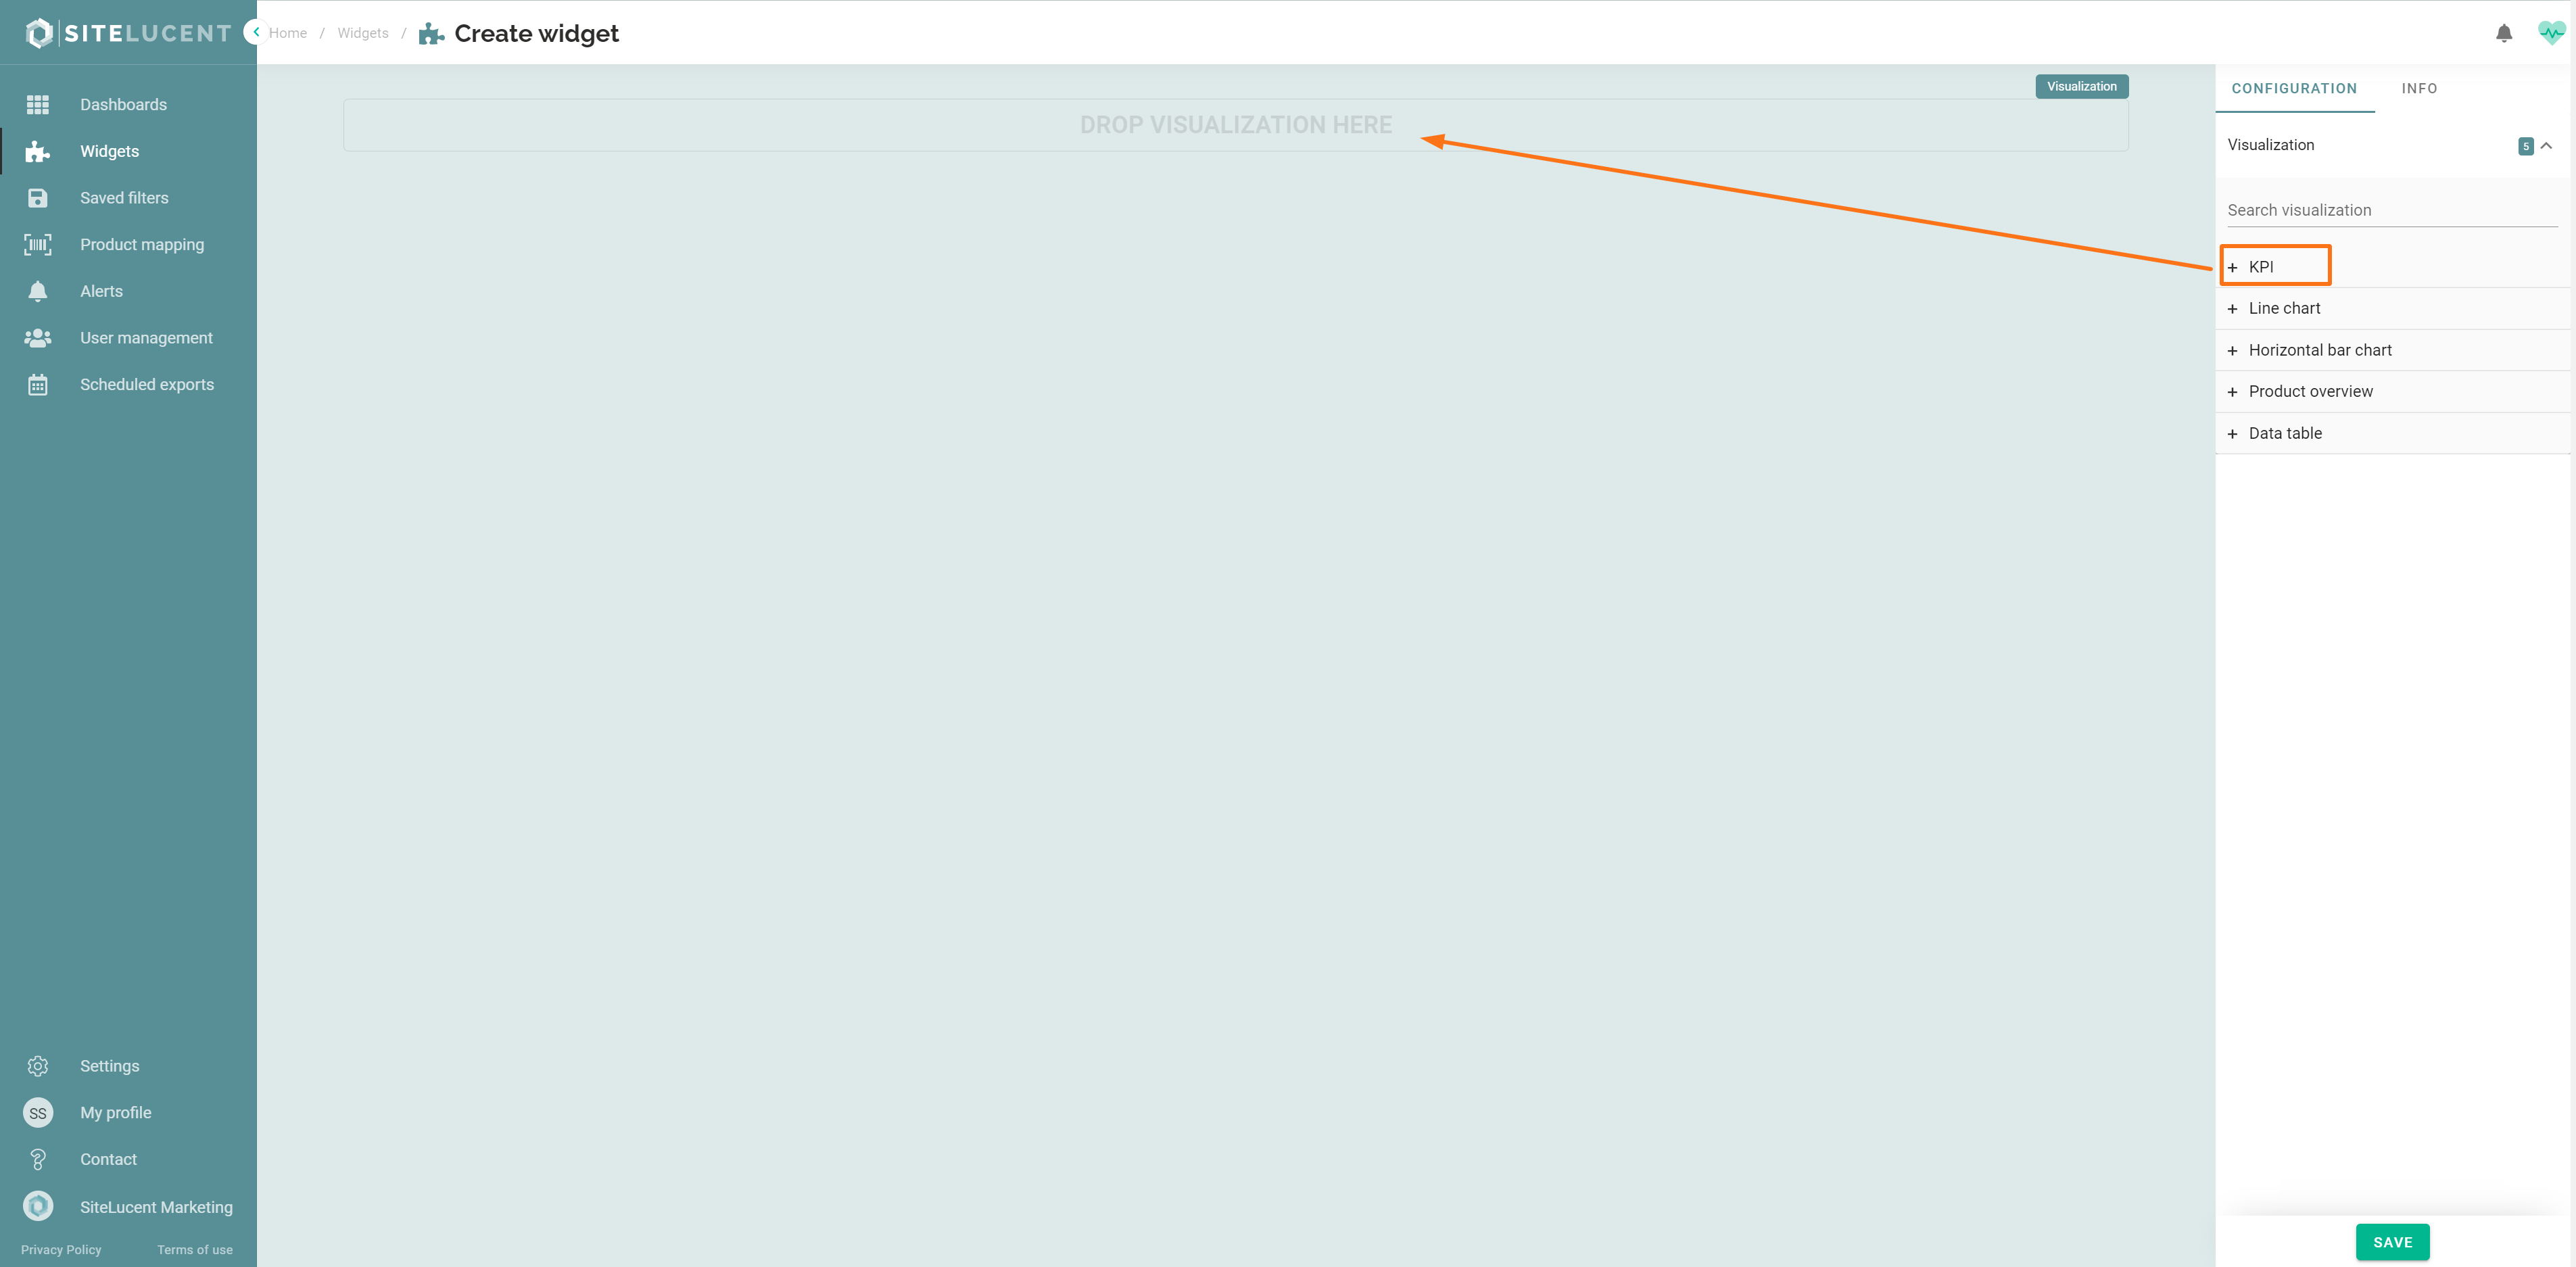
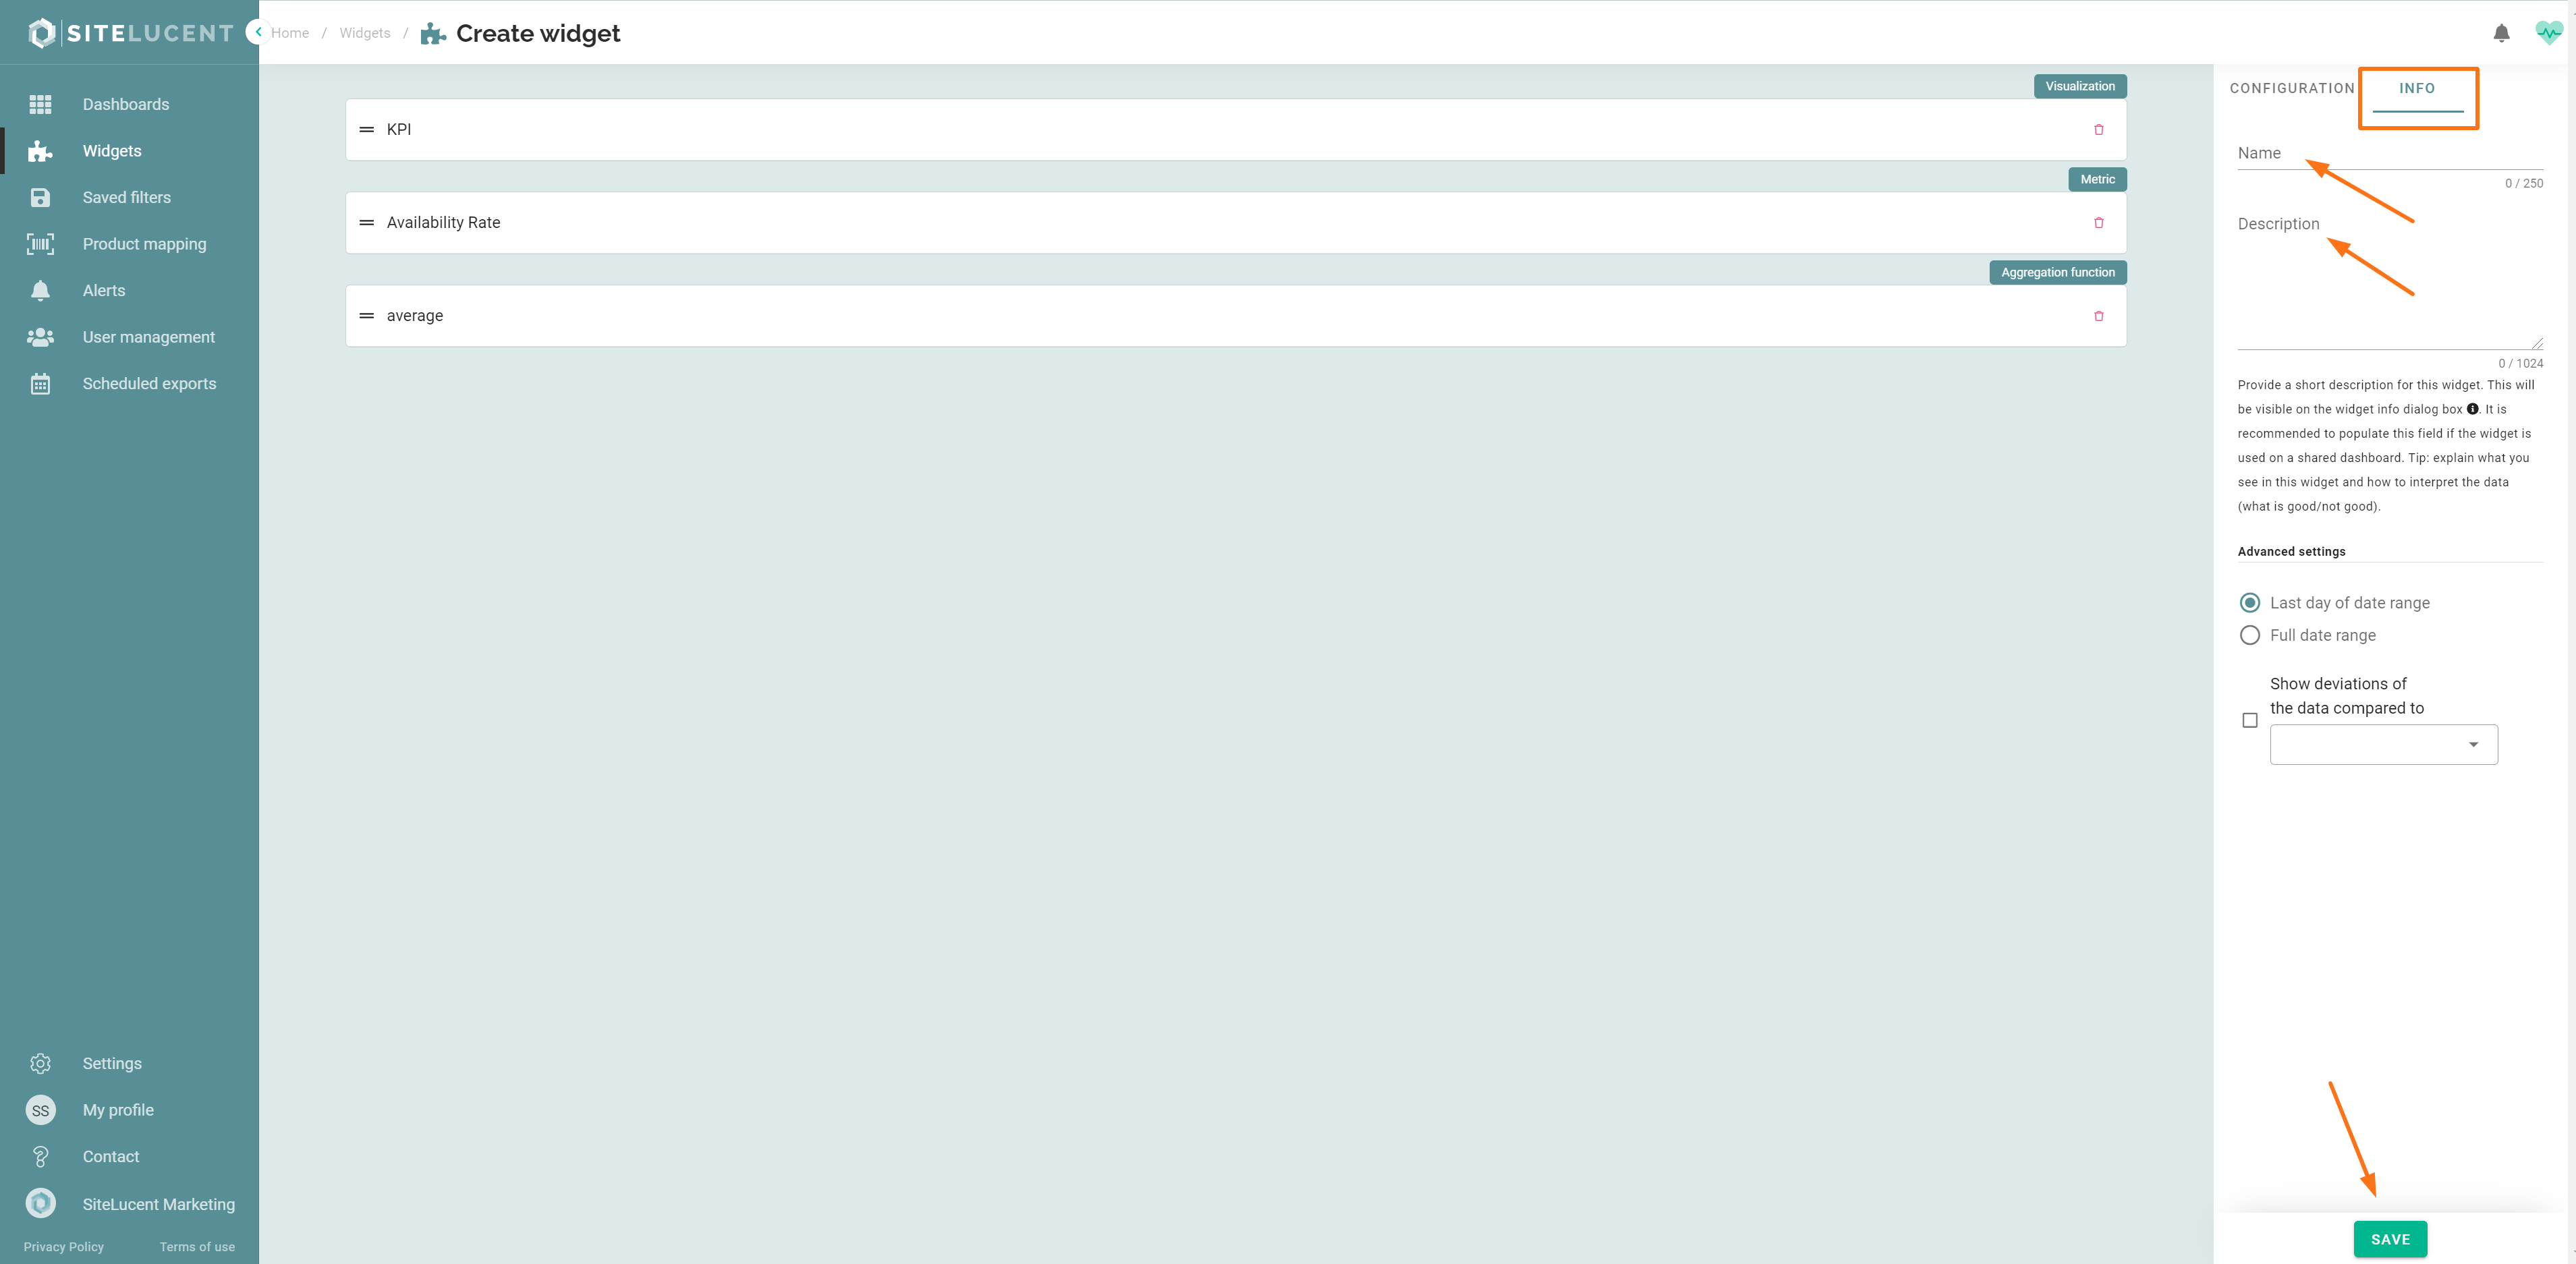
- Choose visualization type KPI: This widget visualization type gives you the percentage, sum, minimum, maximum, count or the average of a certain metric.
- Select 1 metric. use the search bar to search for a specific metric.
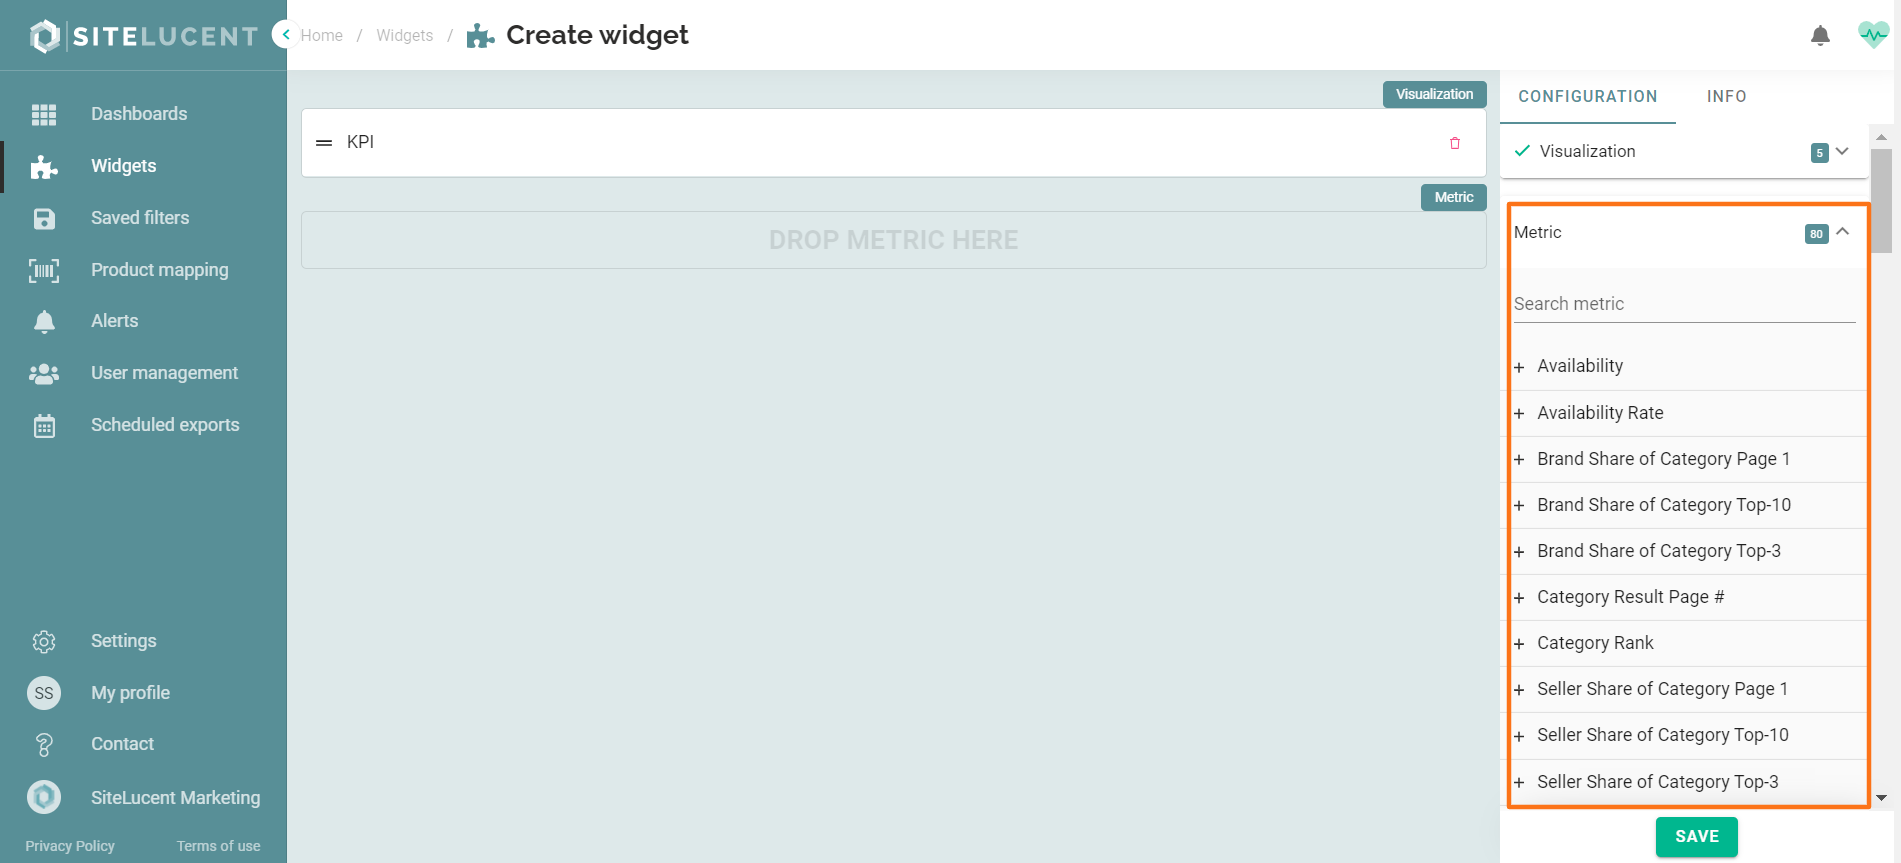
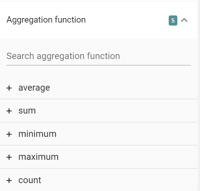
- Then choose and select the aggregation function.
-
- Open the "INFO" tab to add a widget name and description.
Advanced settings:
By default "last day of date range" is selected. If you want to see the KPI for the date range you apply to your filter settings in a dashboard, then select "Full date range".- Click save.
You have now created a new widget. The next step will be to add the widget to a dashboard.