In this article we explain you how to create a new line chart widget from scratch.
To create a new line chart widget you first:
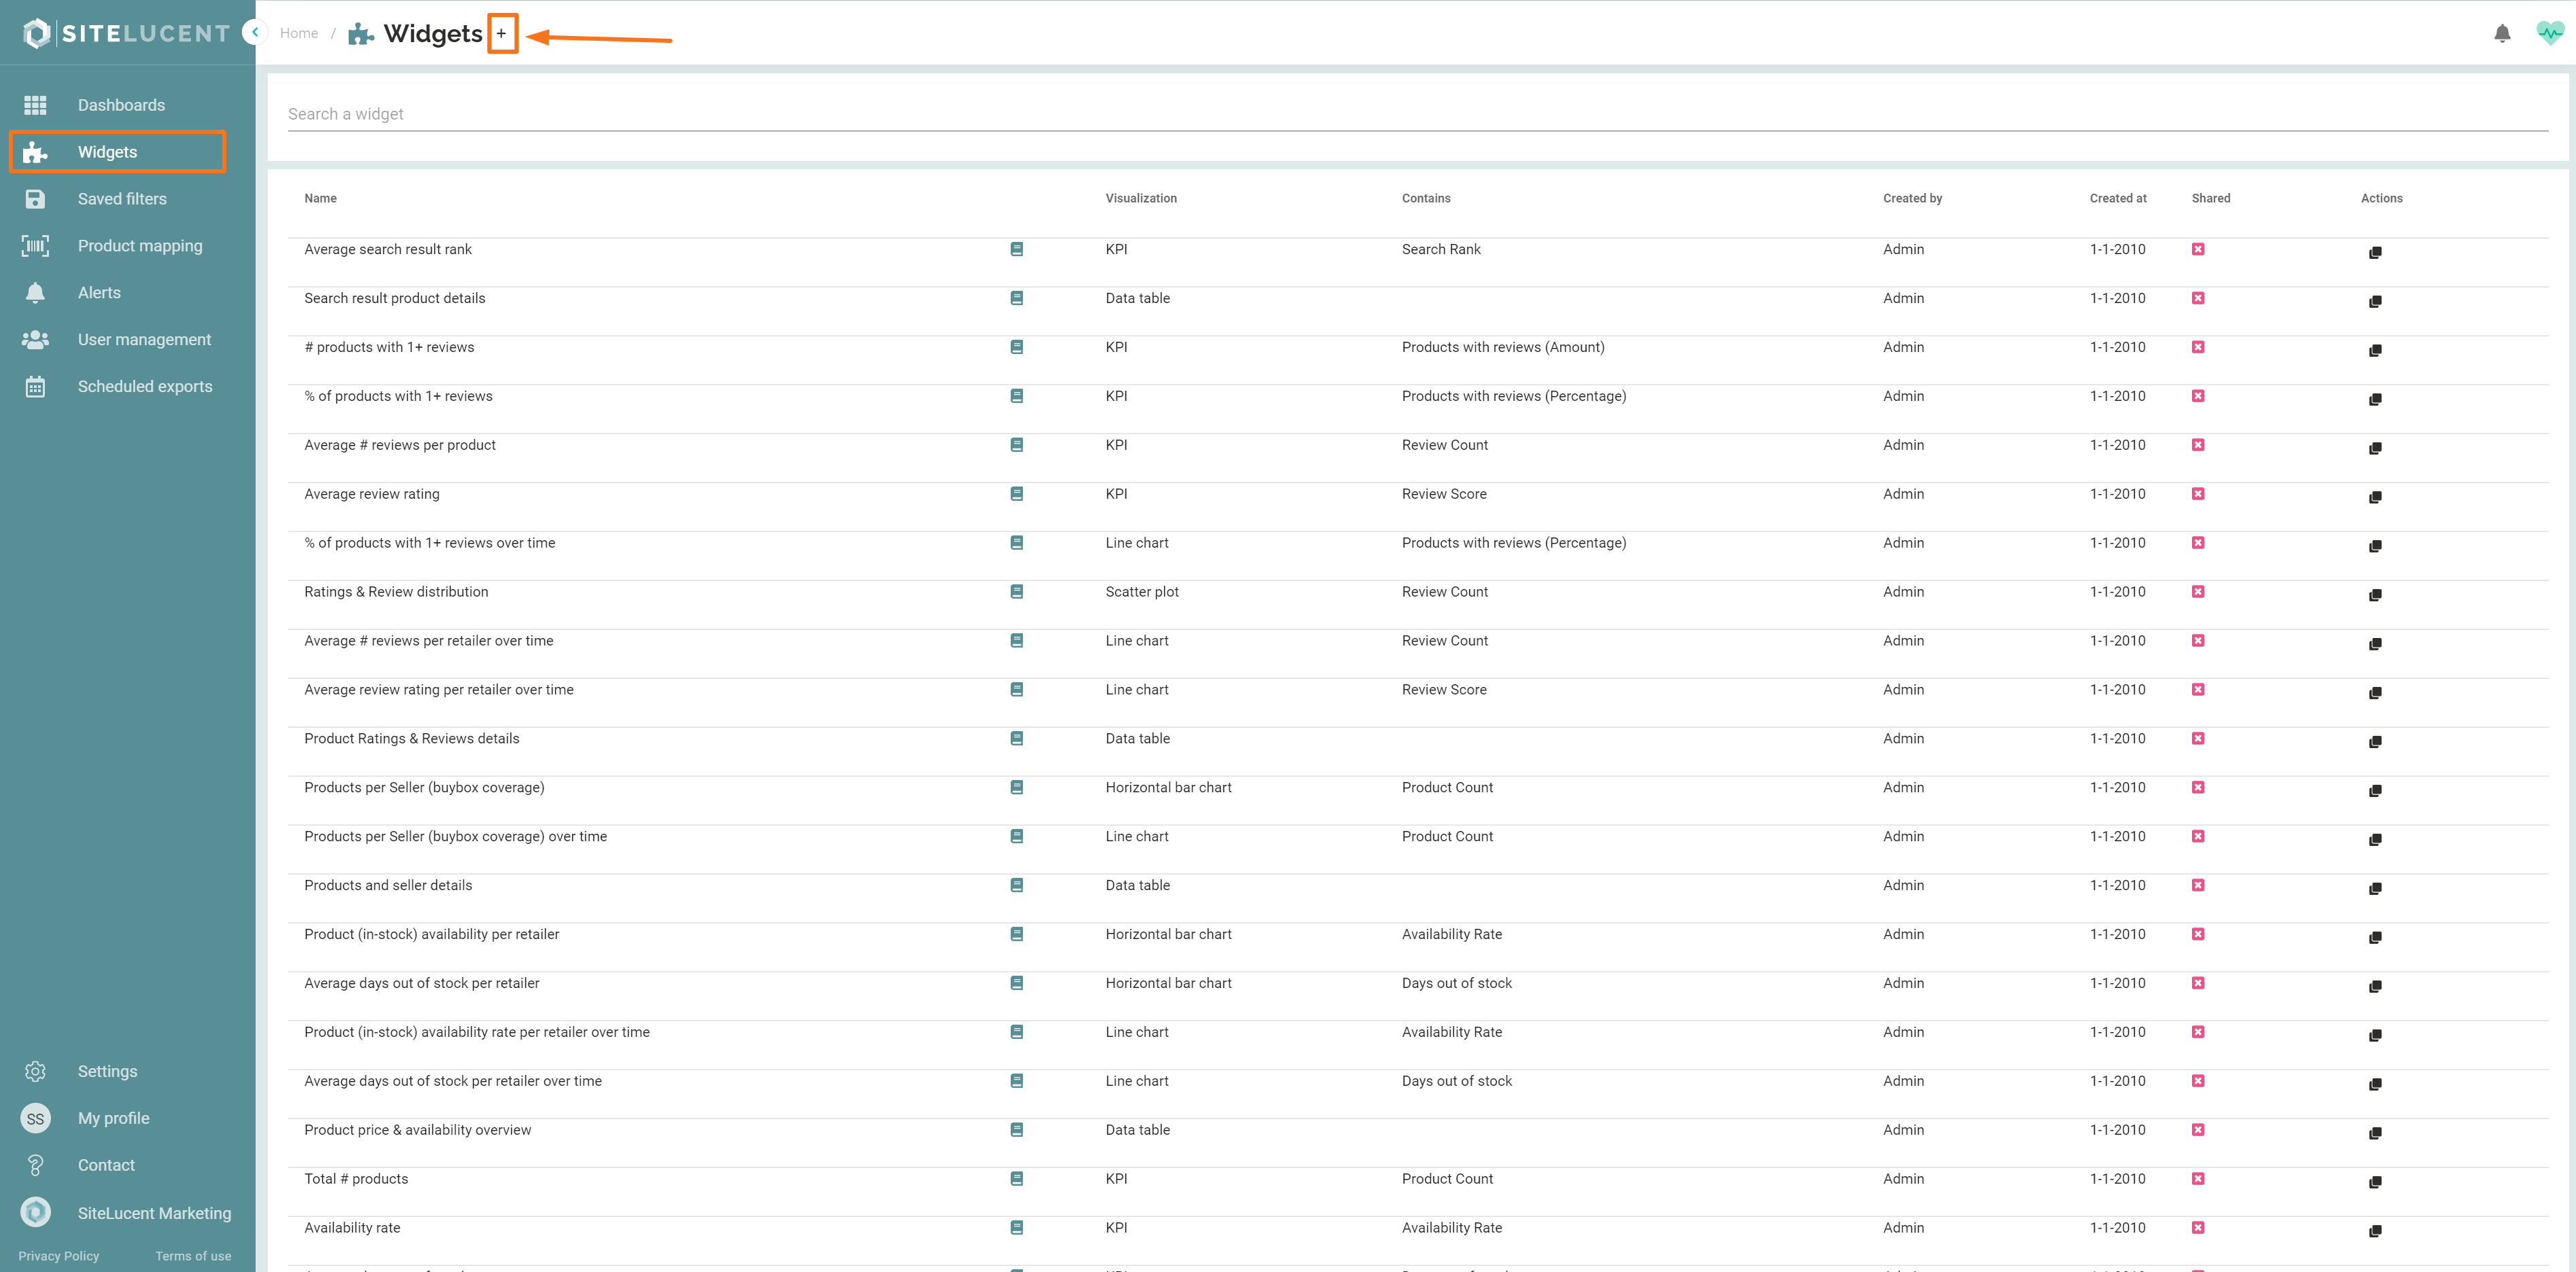
- Navigate to the widgets section
 in the left menu
 - Then click the " + " right next to "Widgets"
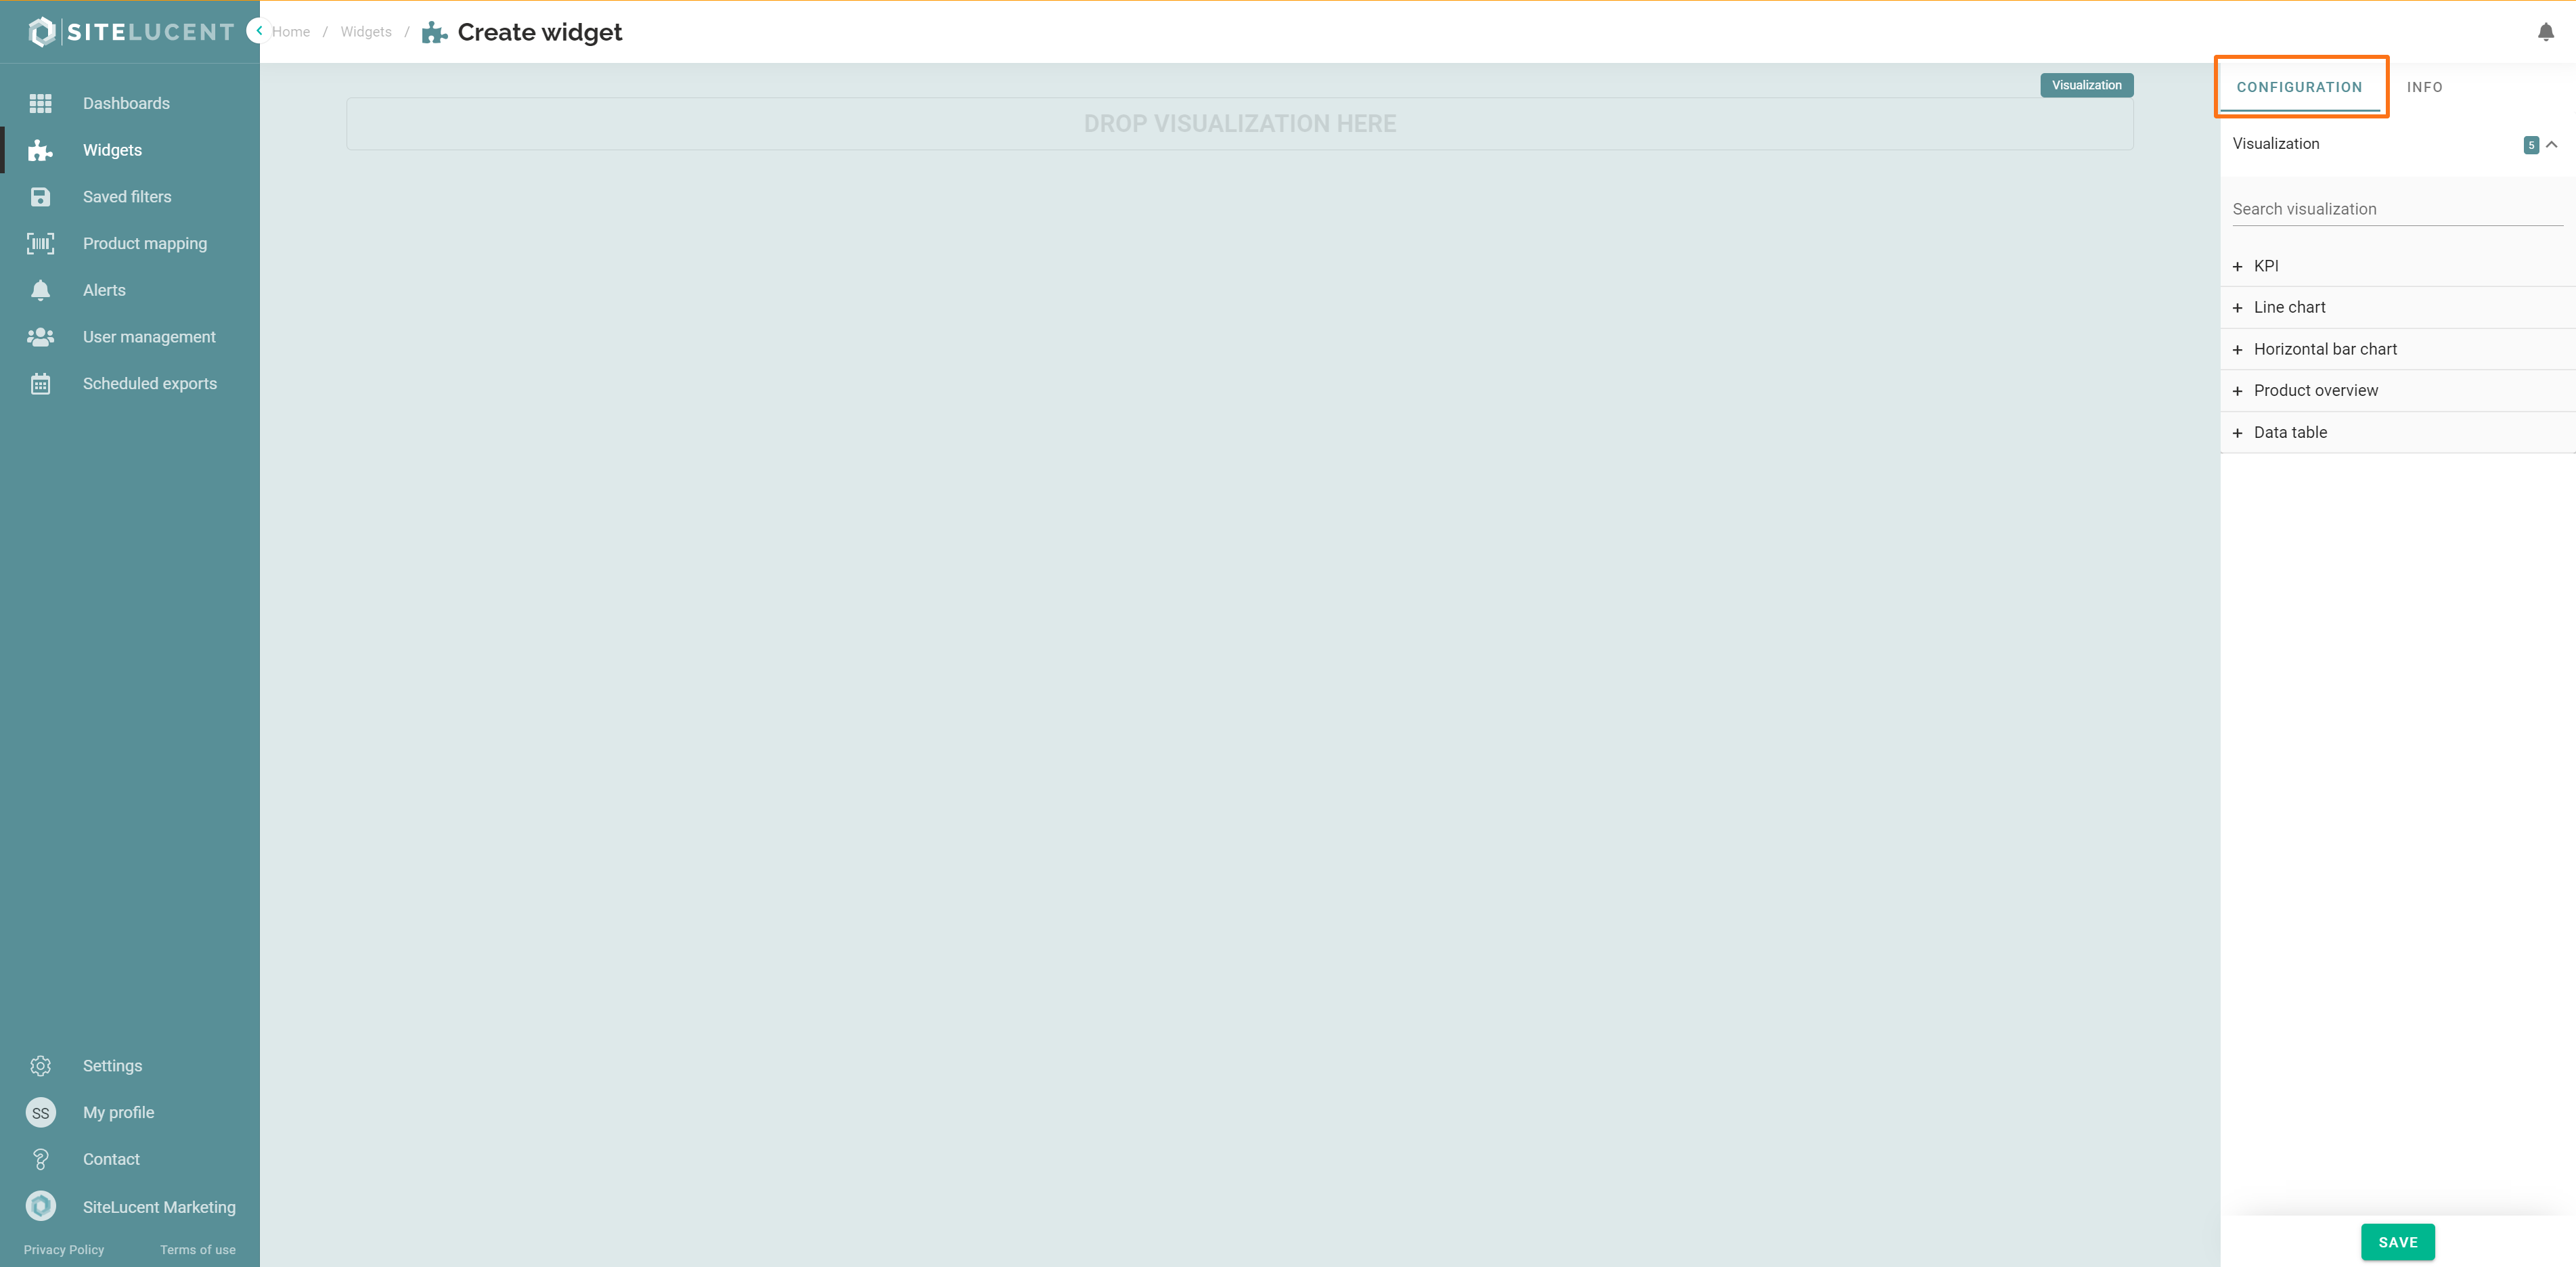
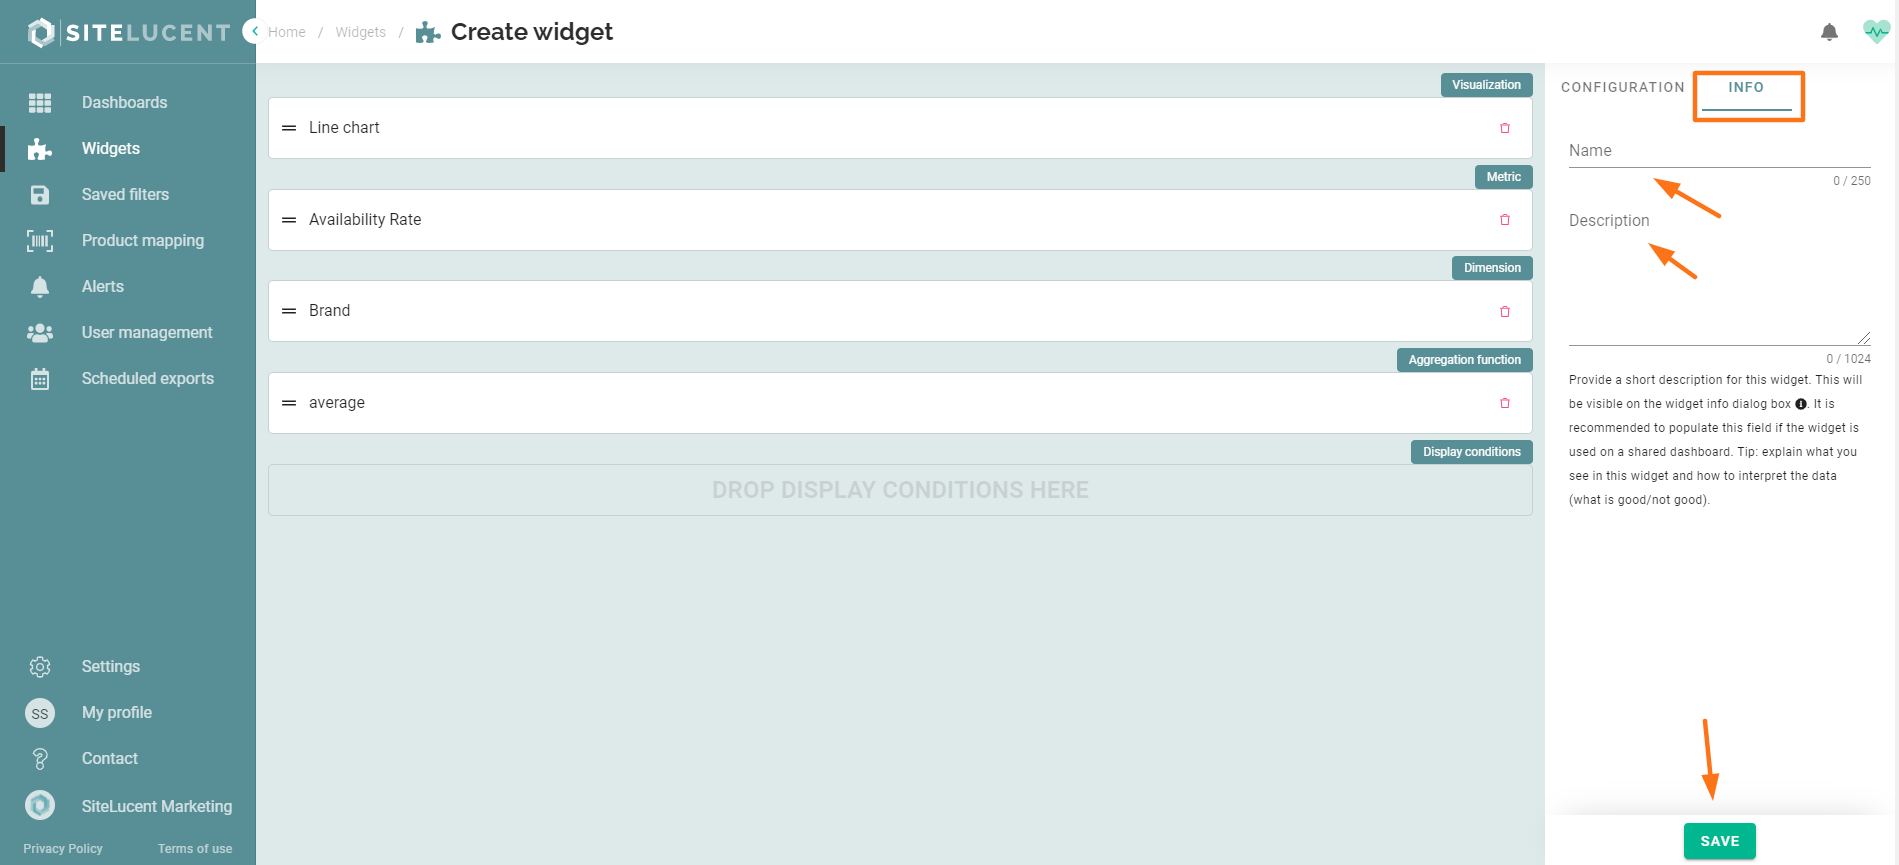
In the "Configuration" tab on the right side of your screen, you first:
- Choose visualization type "Line chart": Line charts are typically used to get insights into how a metric develops over time.
- Select only 1 metric of your choice.
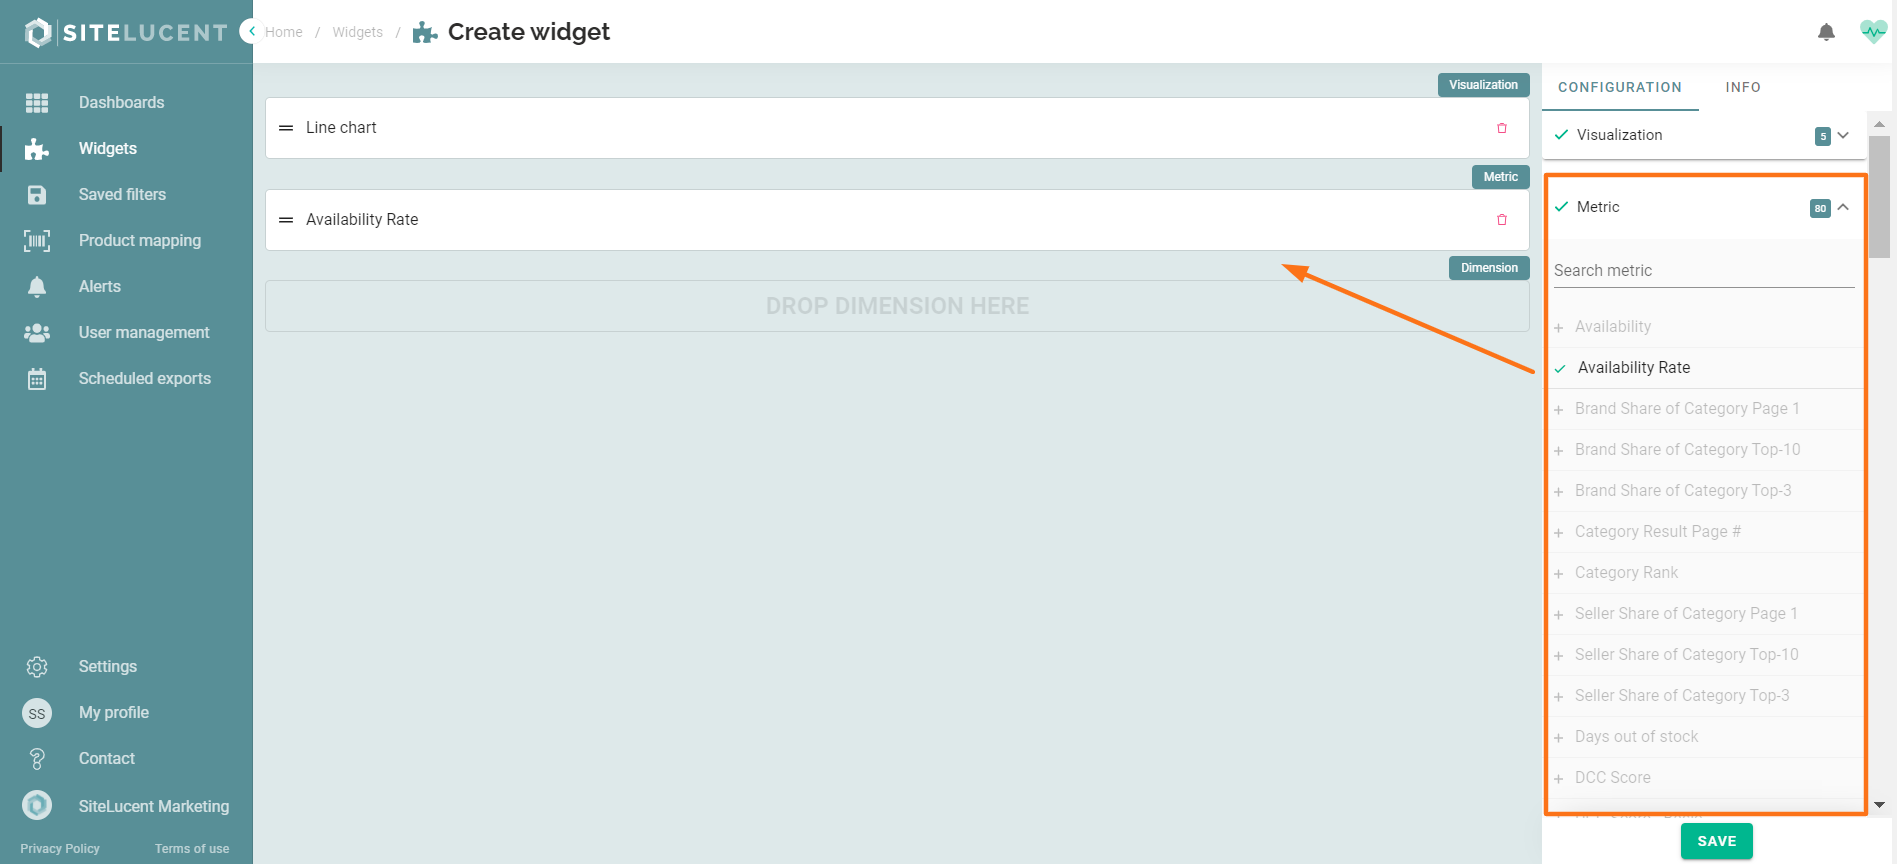
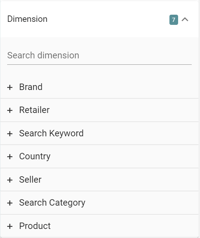
- Then choose and select the dimension.
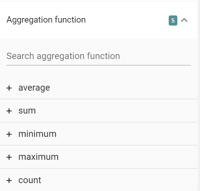
- Then choose and select the aggregation function
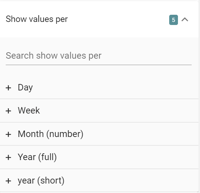
- Then show value per:
- Open the "INFO" tab to add a widget name and description.
- Click save.
You have now created a new widget. The next step will be to add the widget to a dashboard