In this article, we explain to you how to create a new Performance Overview widget from scratch.
To create a new Performance Overview widget with conditional coloring you first:
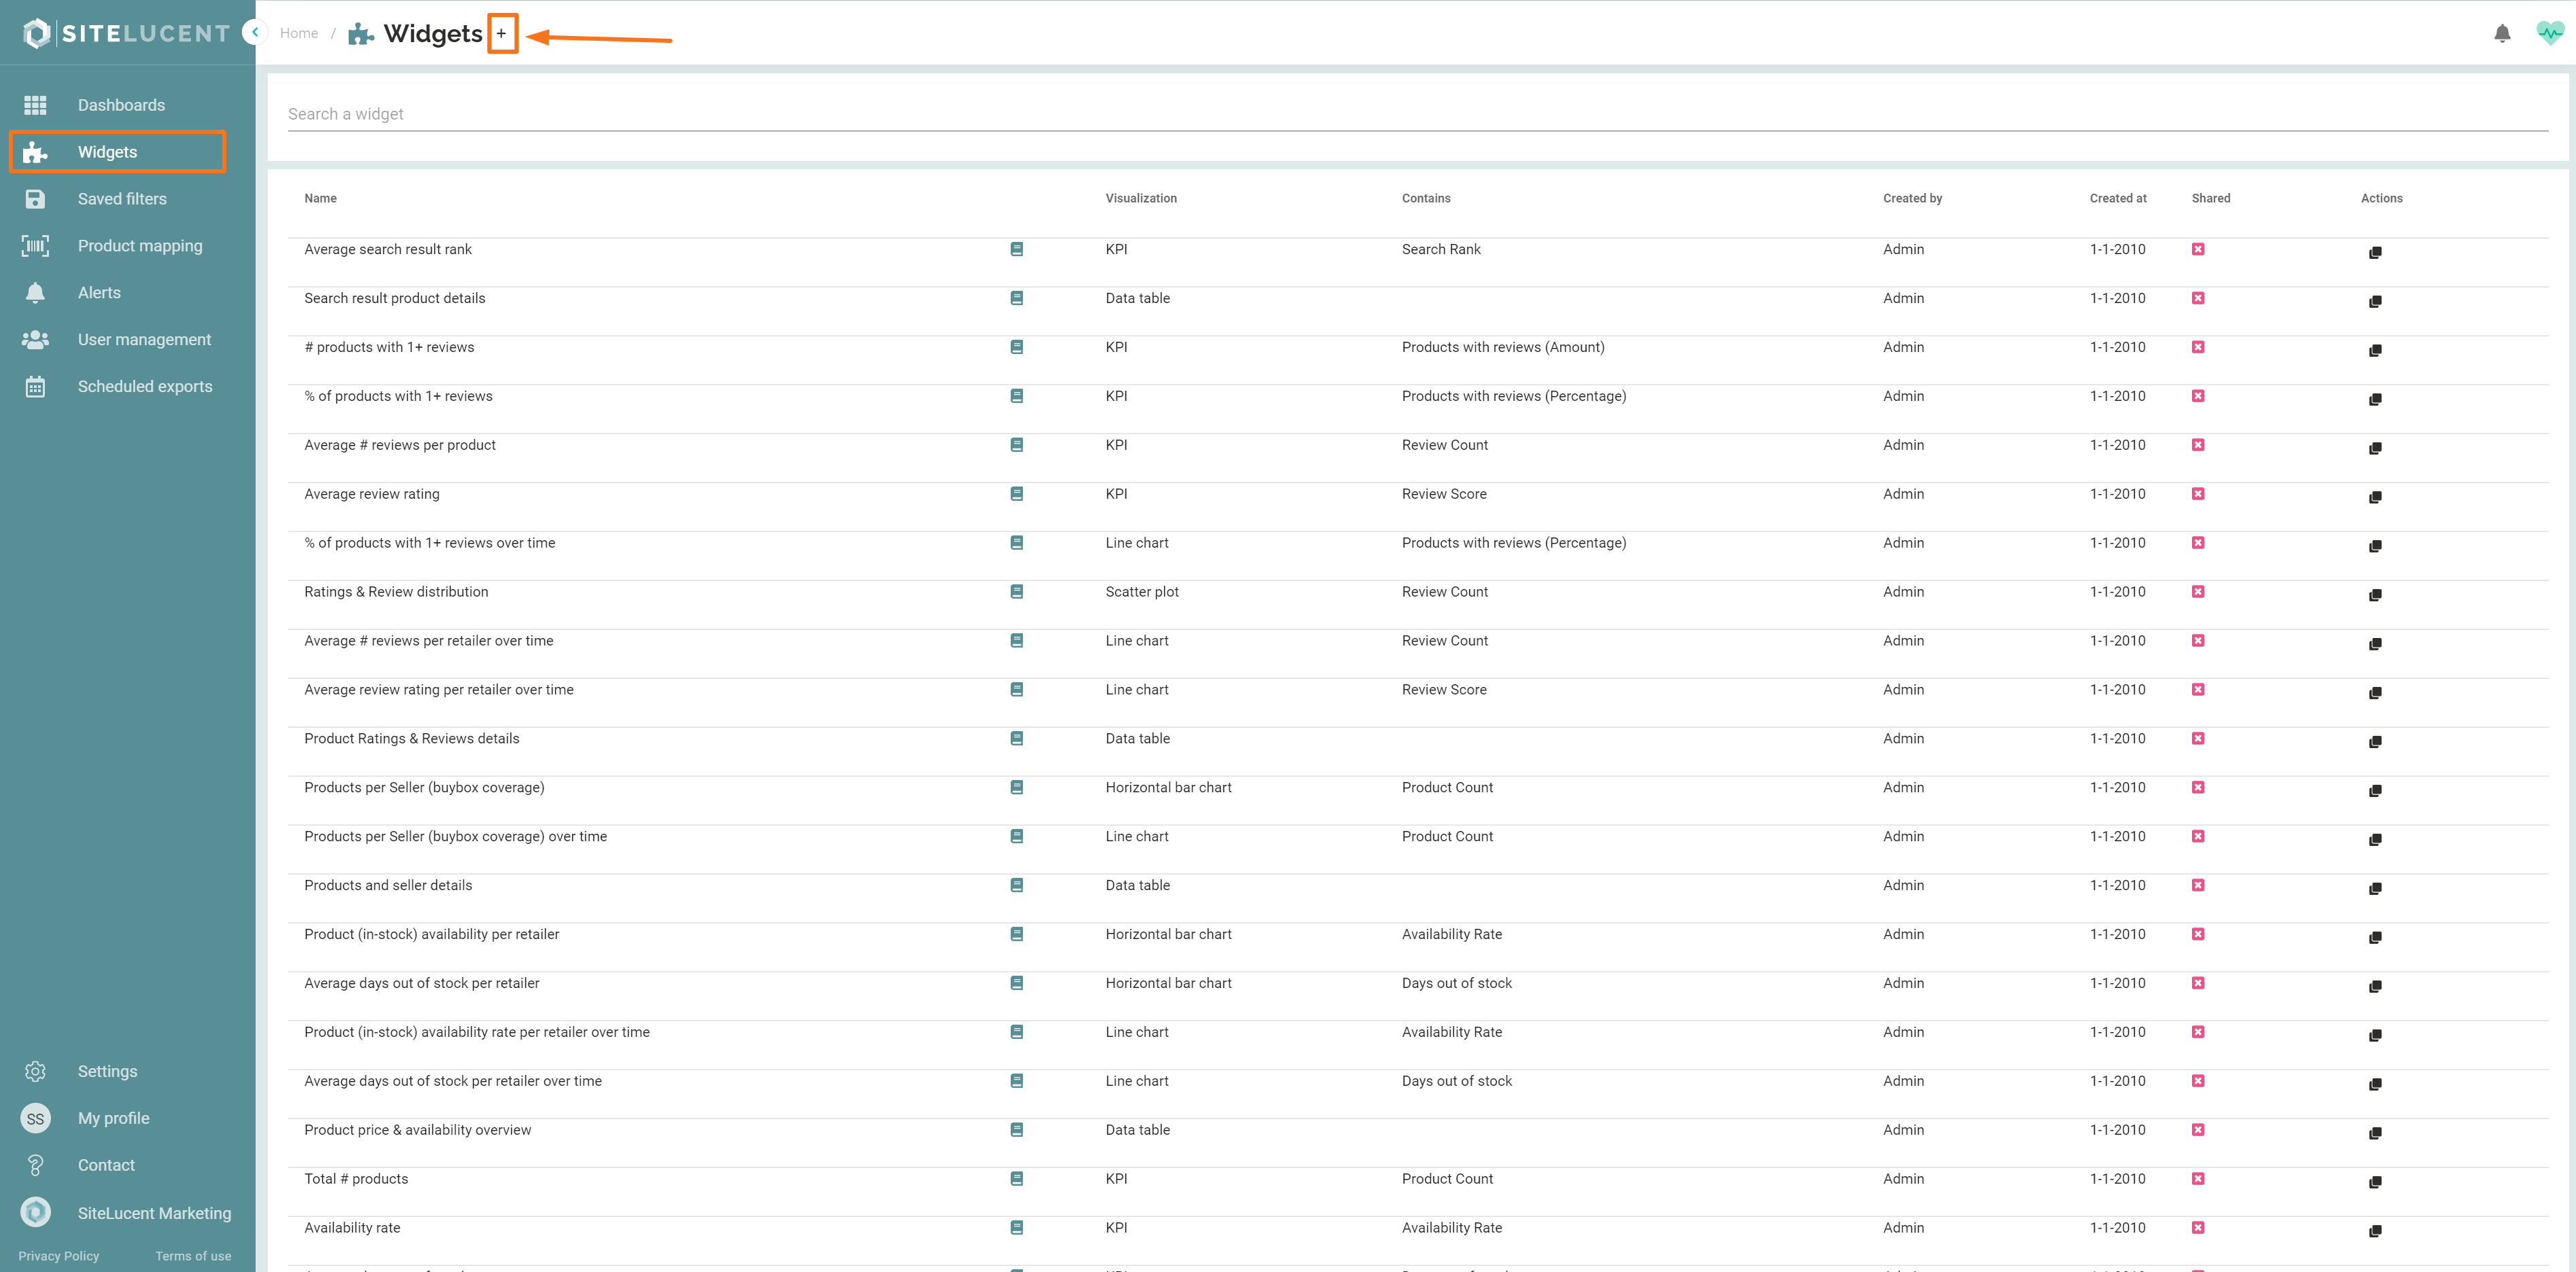
- Navigate to the widgets section
 in the left menu.
 - Then click the ' + ' right next to 'Widgets'.
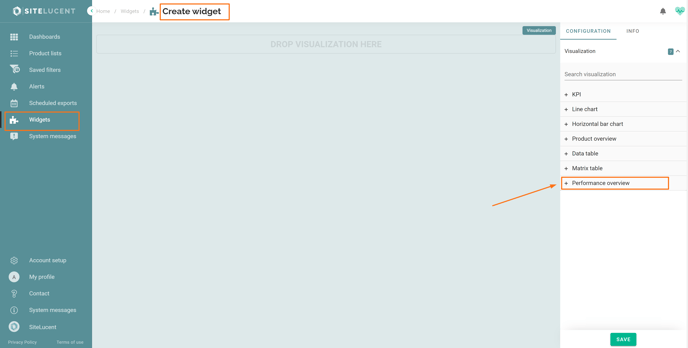
In the 'Configuration' tab on the right side of your screen, you choose visualization type 'Performance Overview'.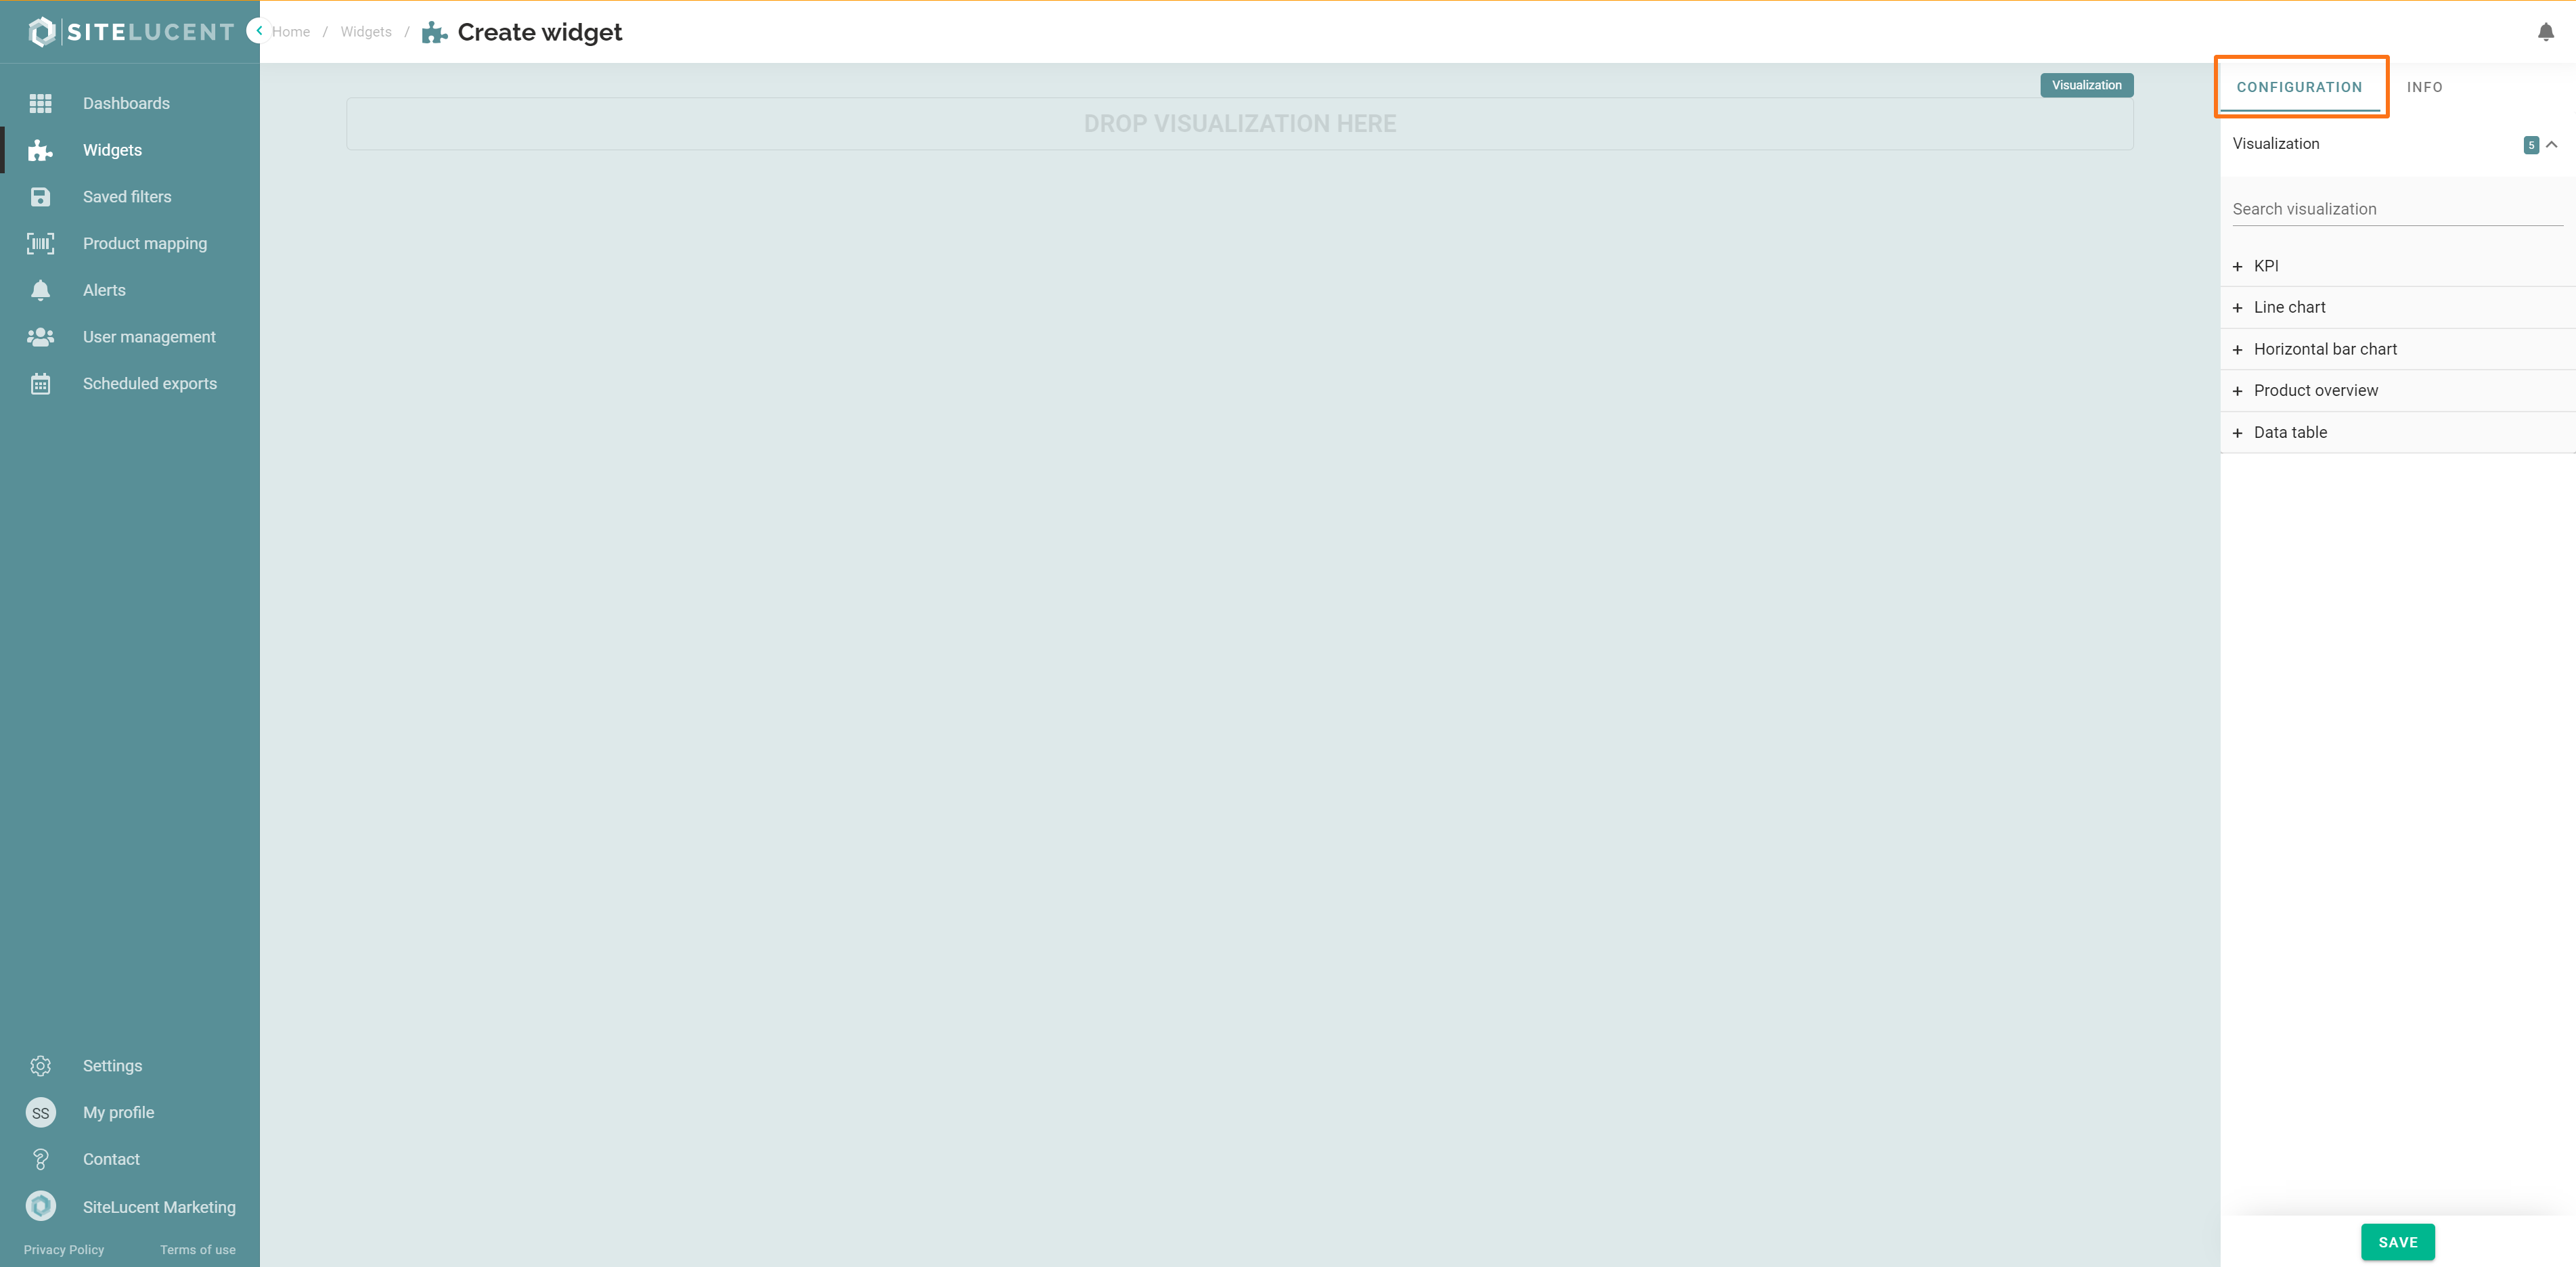
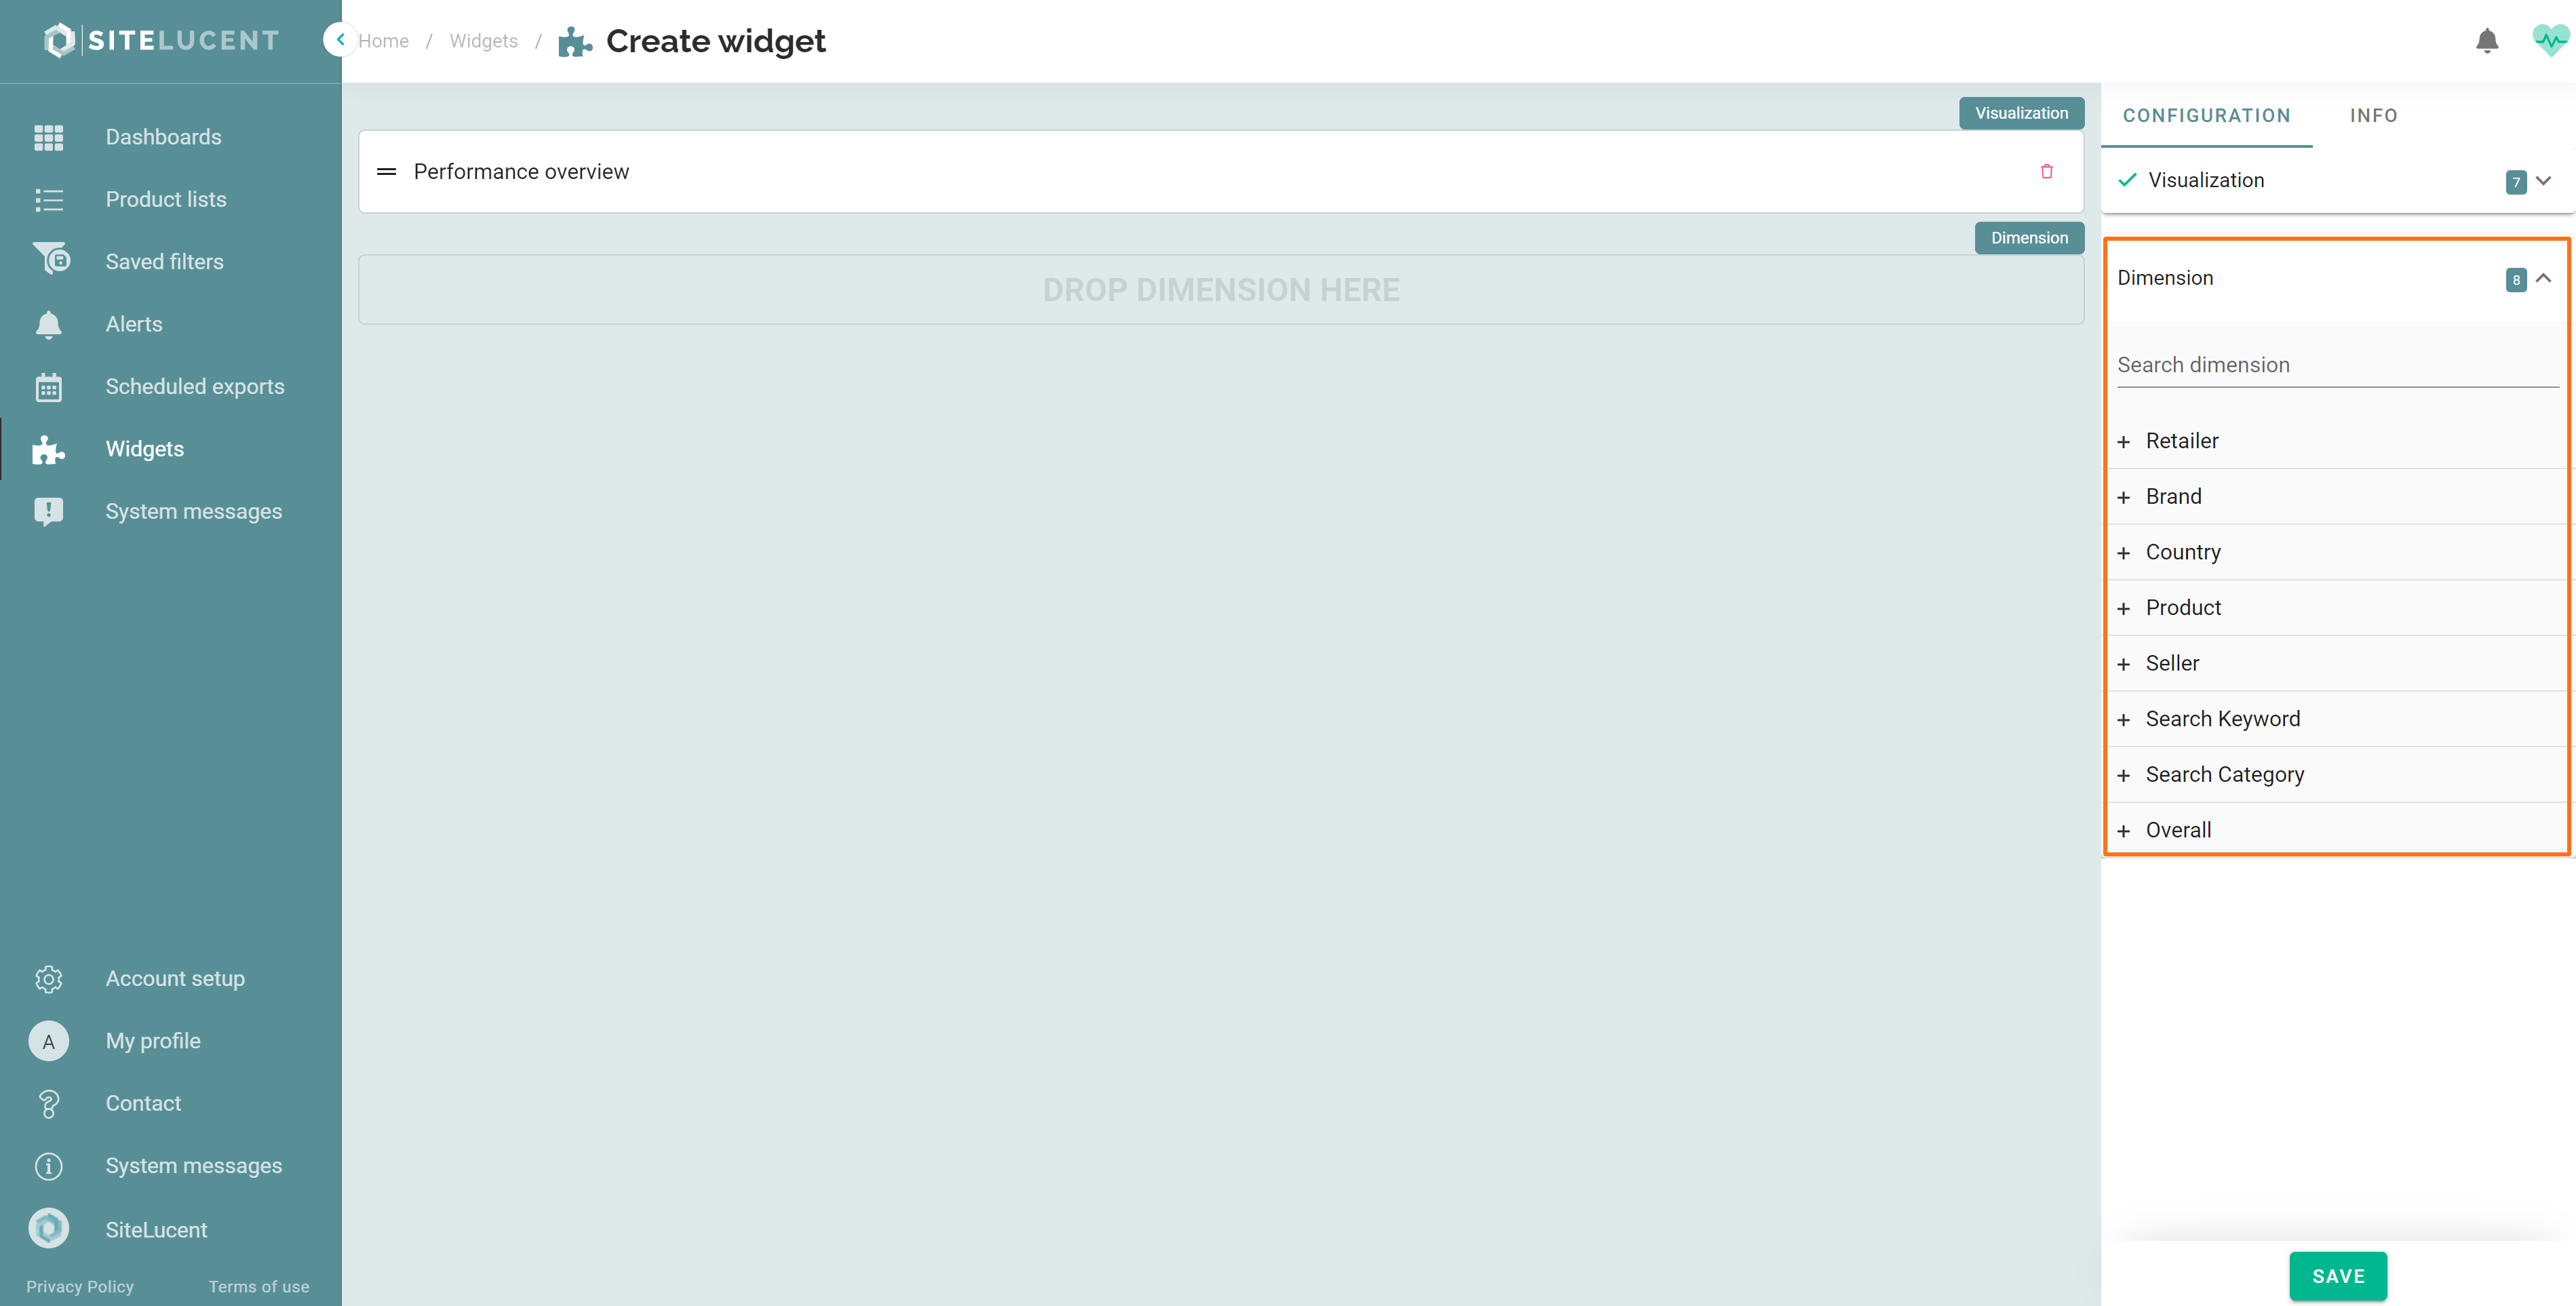
- Select a dimension. In the following example, we chose 'retailer'. The one you choose will apply as the default dimension, but you can always switch dimensions in a dashboard view later.
- Then you start adding column groups/topics.
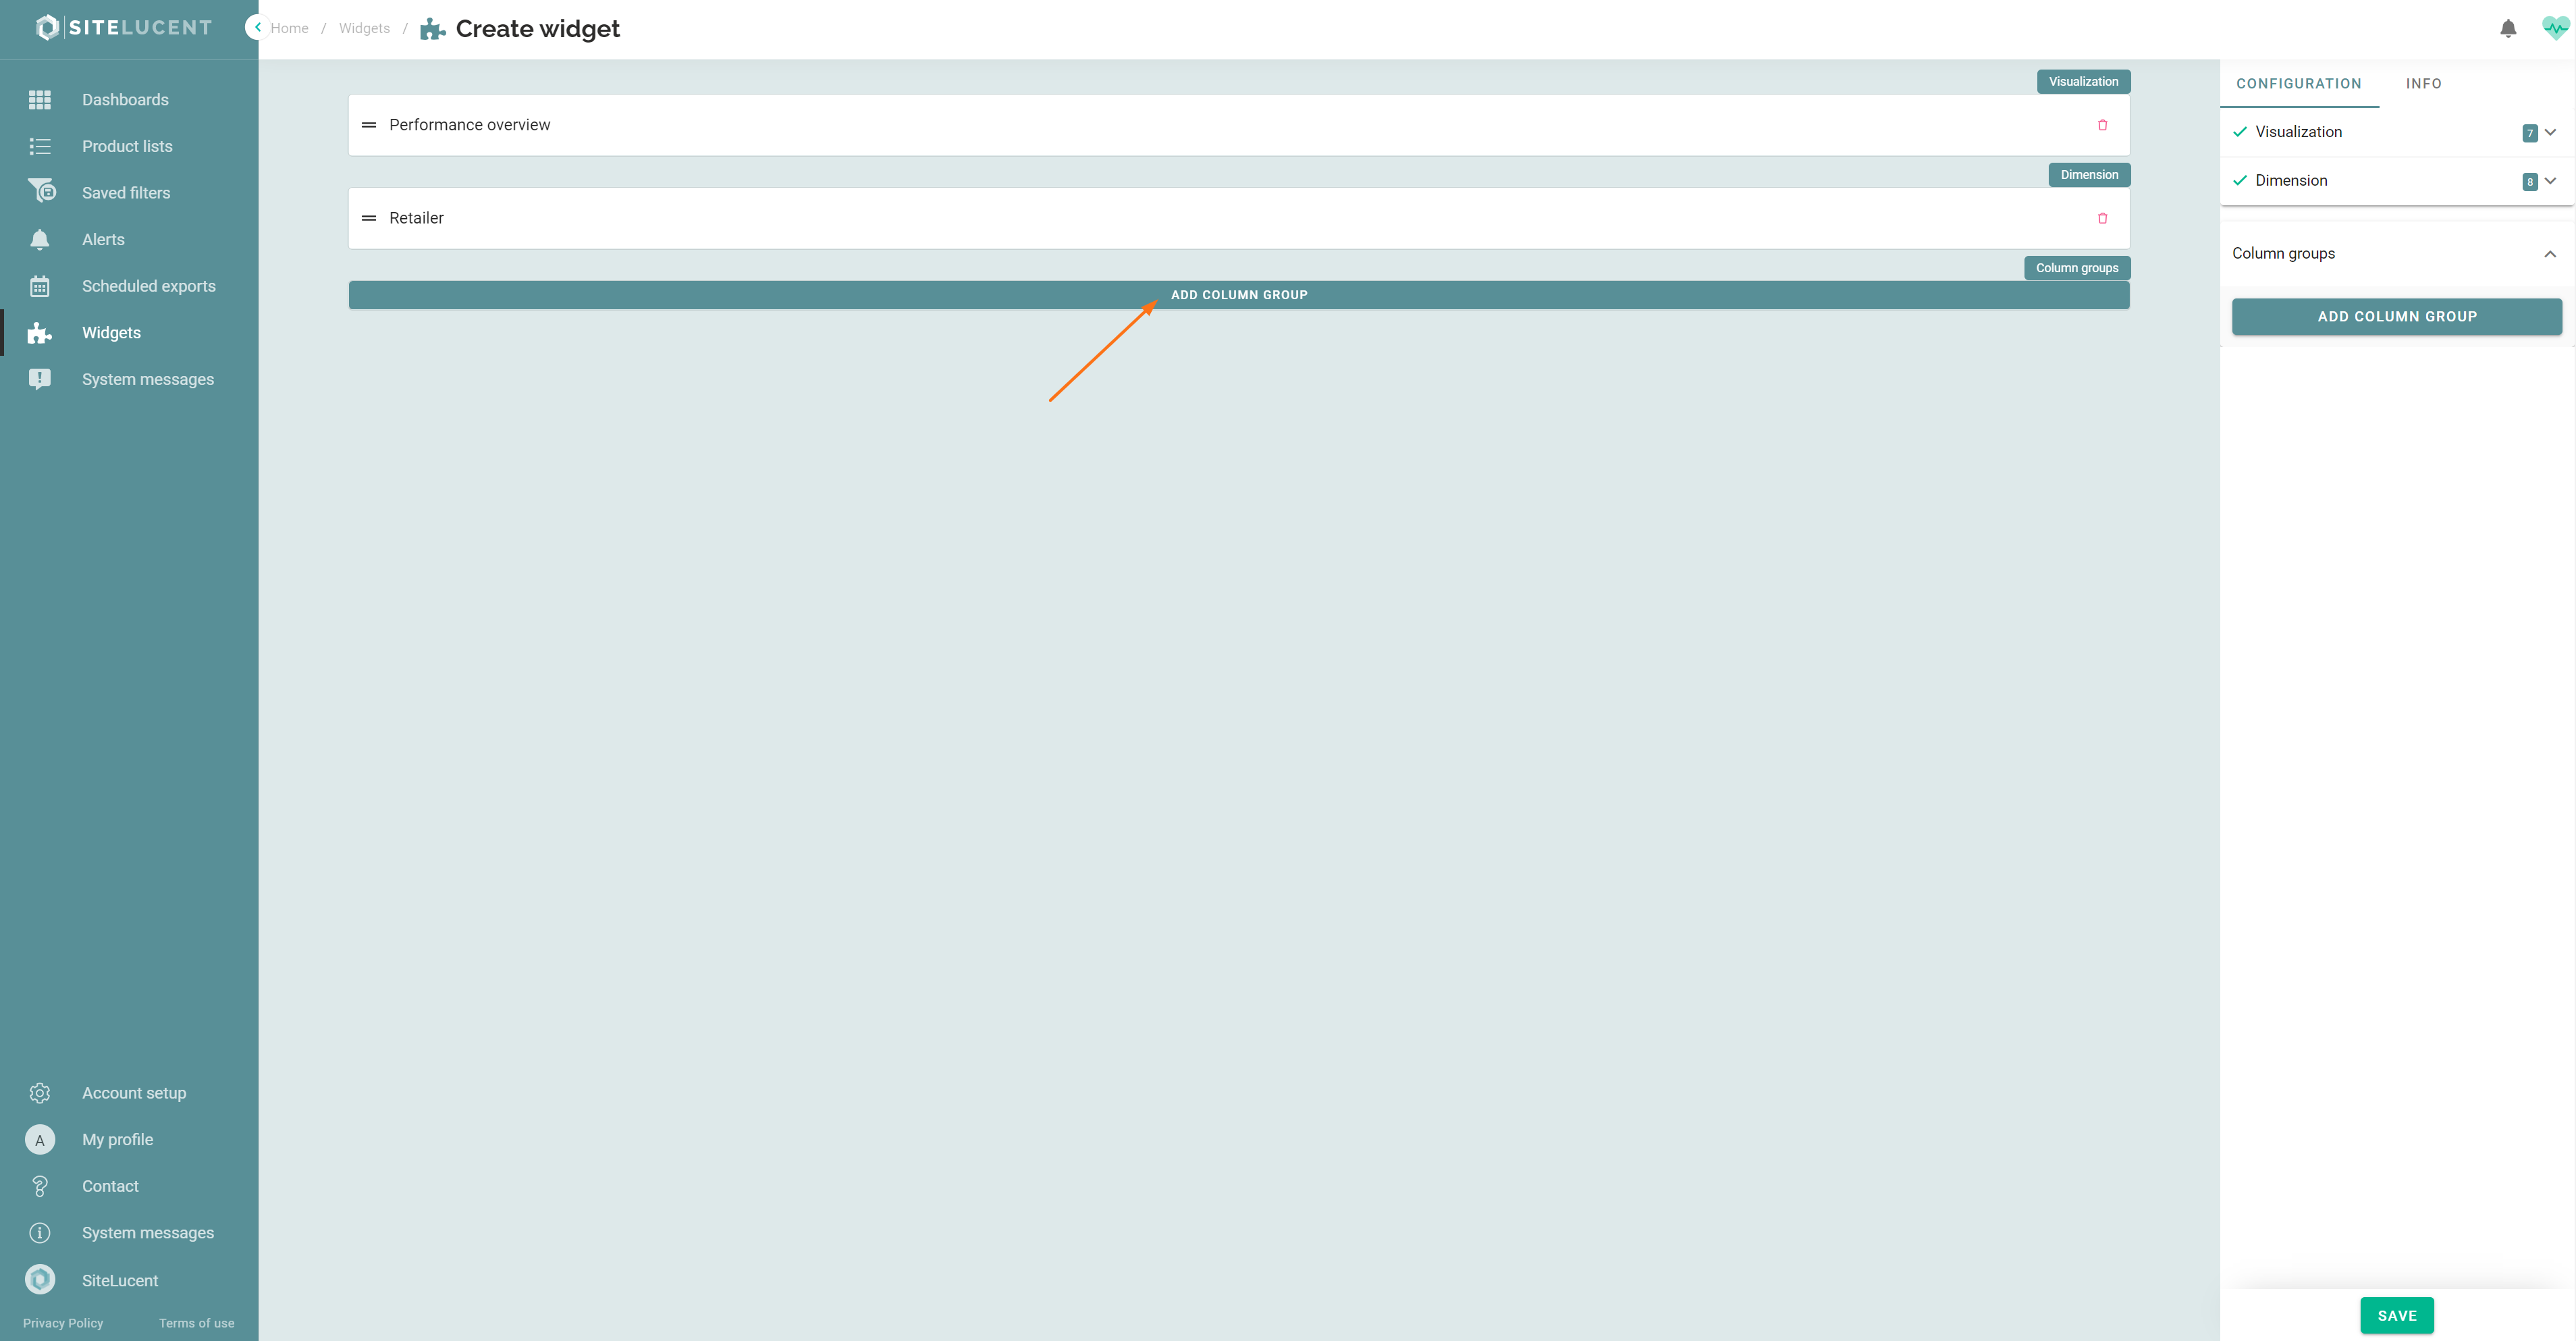
- Name the column groups
- Pick a color for your column groups (optional)
- Choose an icon
- Choose which dashboard you want to link to when clicking the icon (optional).
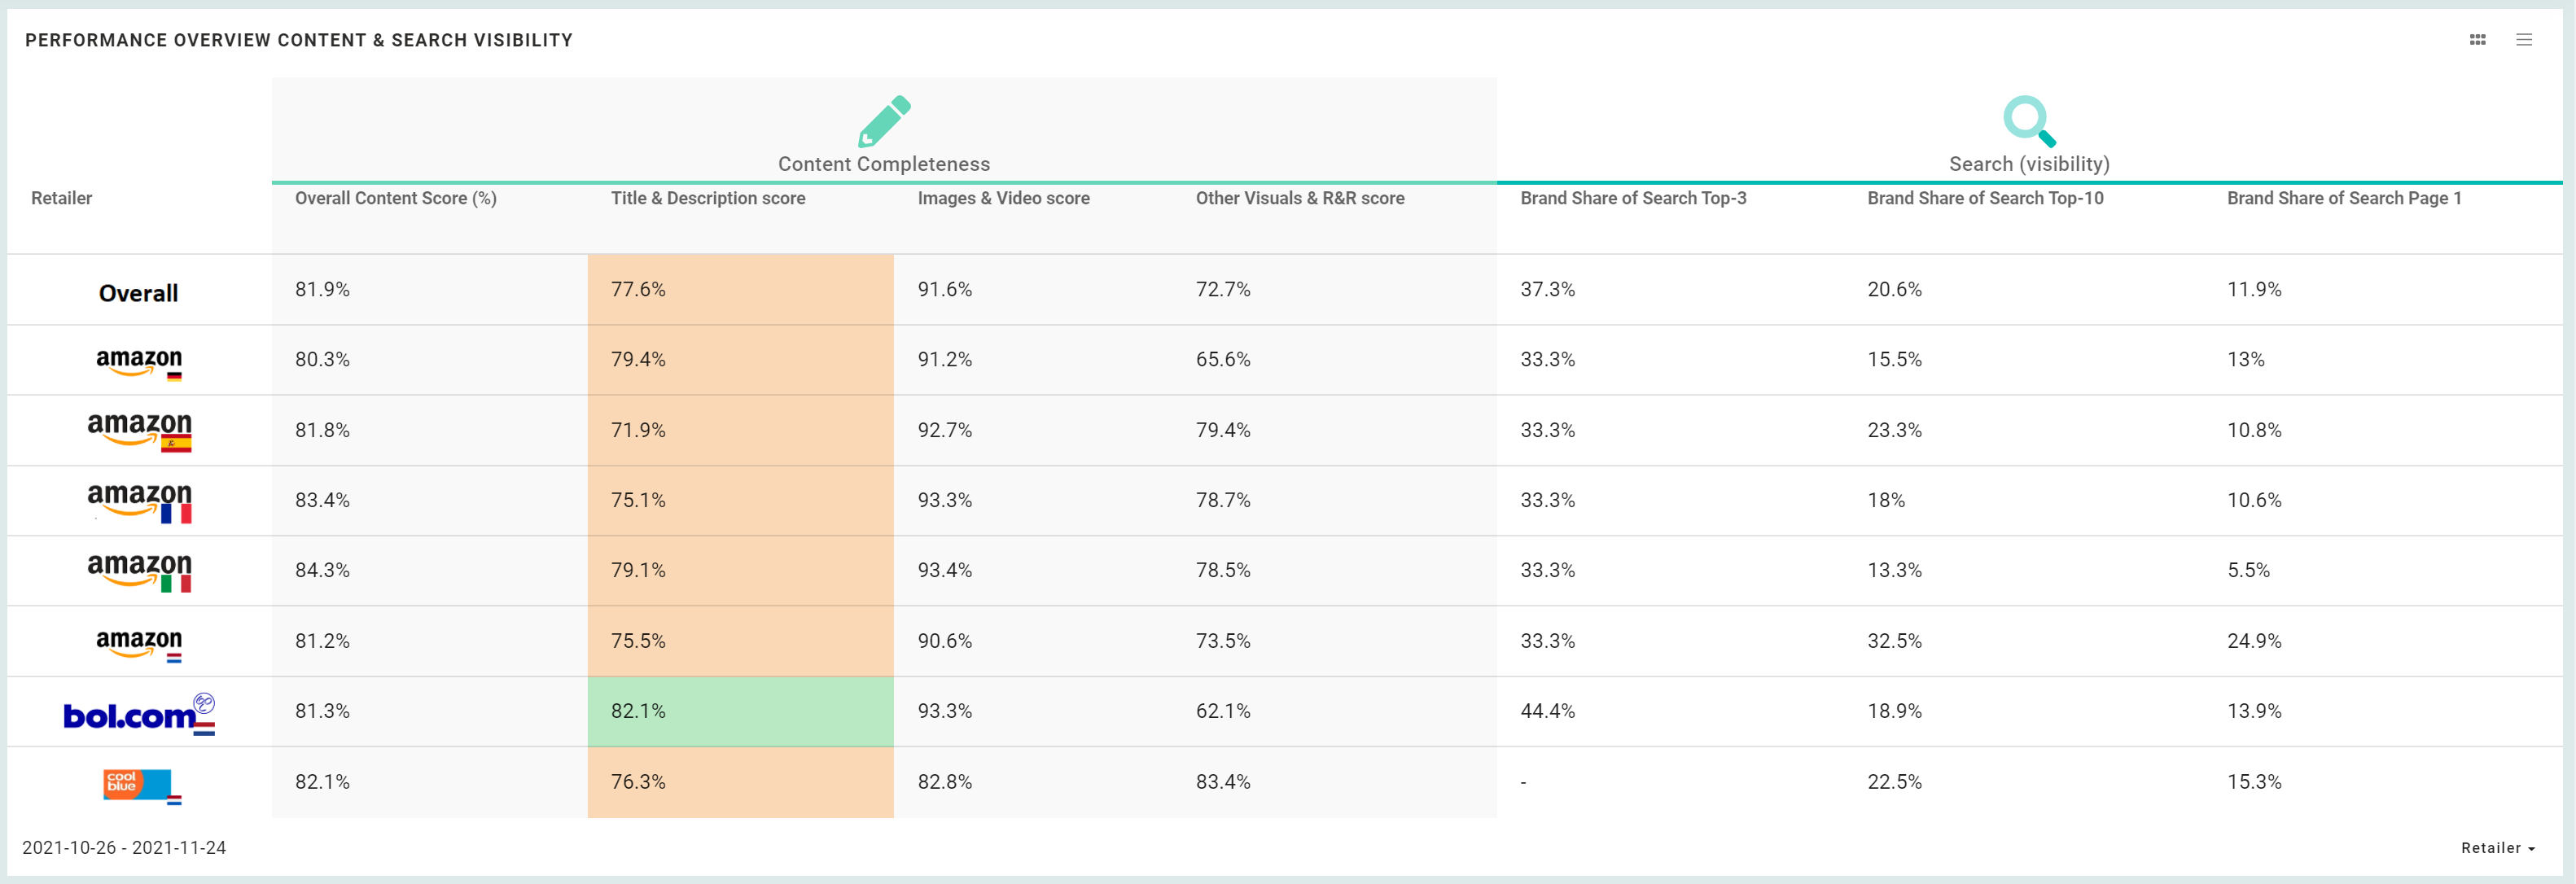
- In our example (see the image below), we created 2 column groups/topics: Content Completeness and Search (visibility).
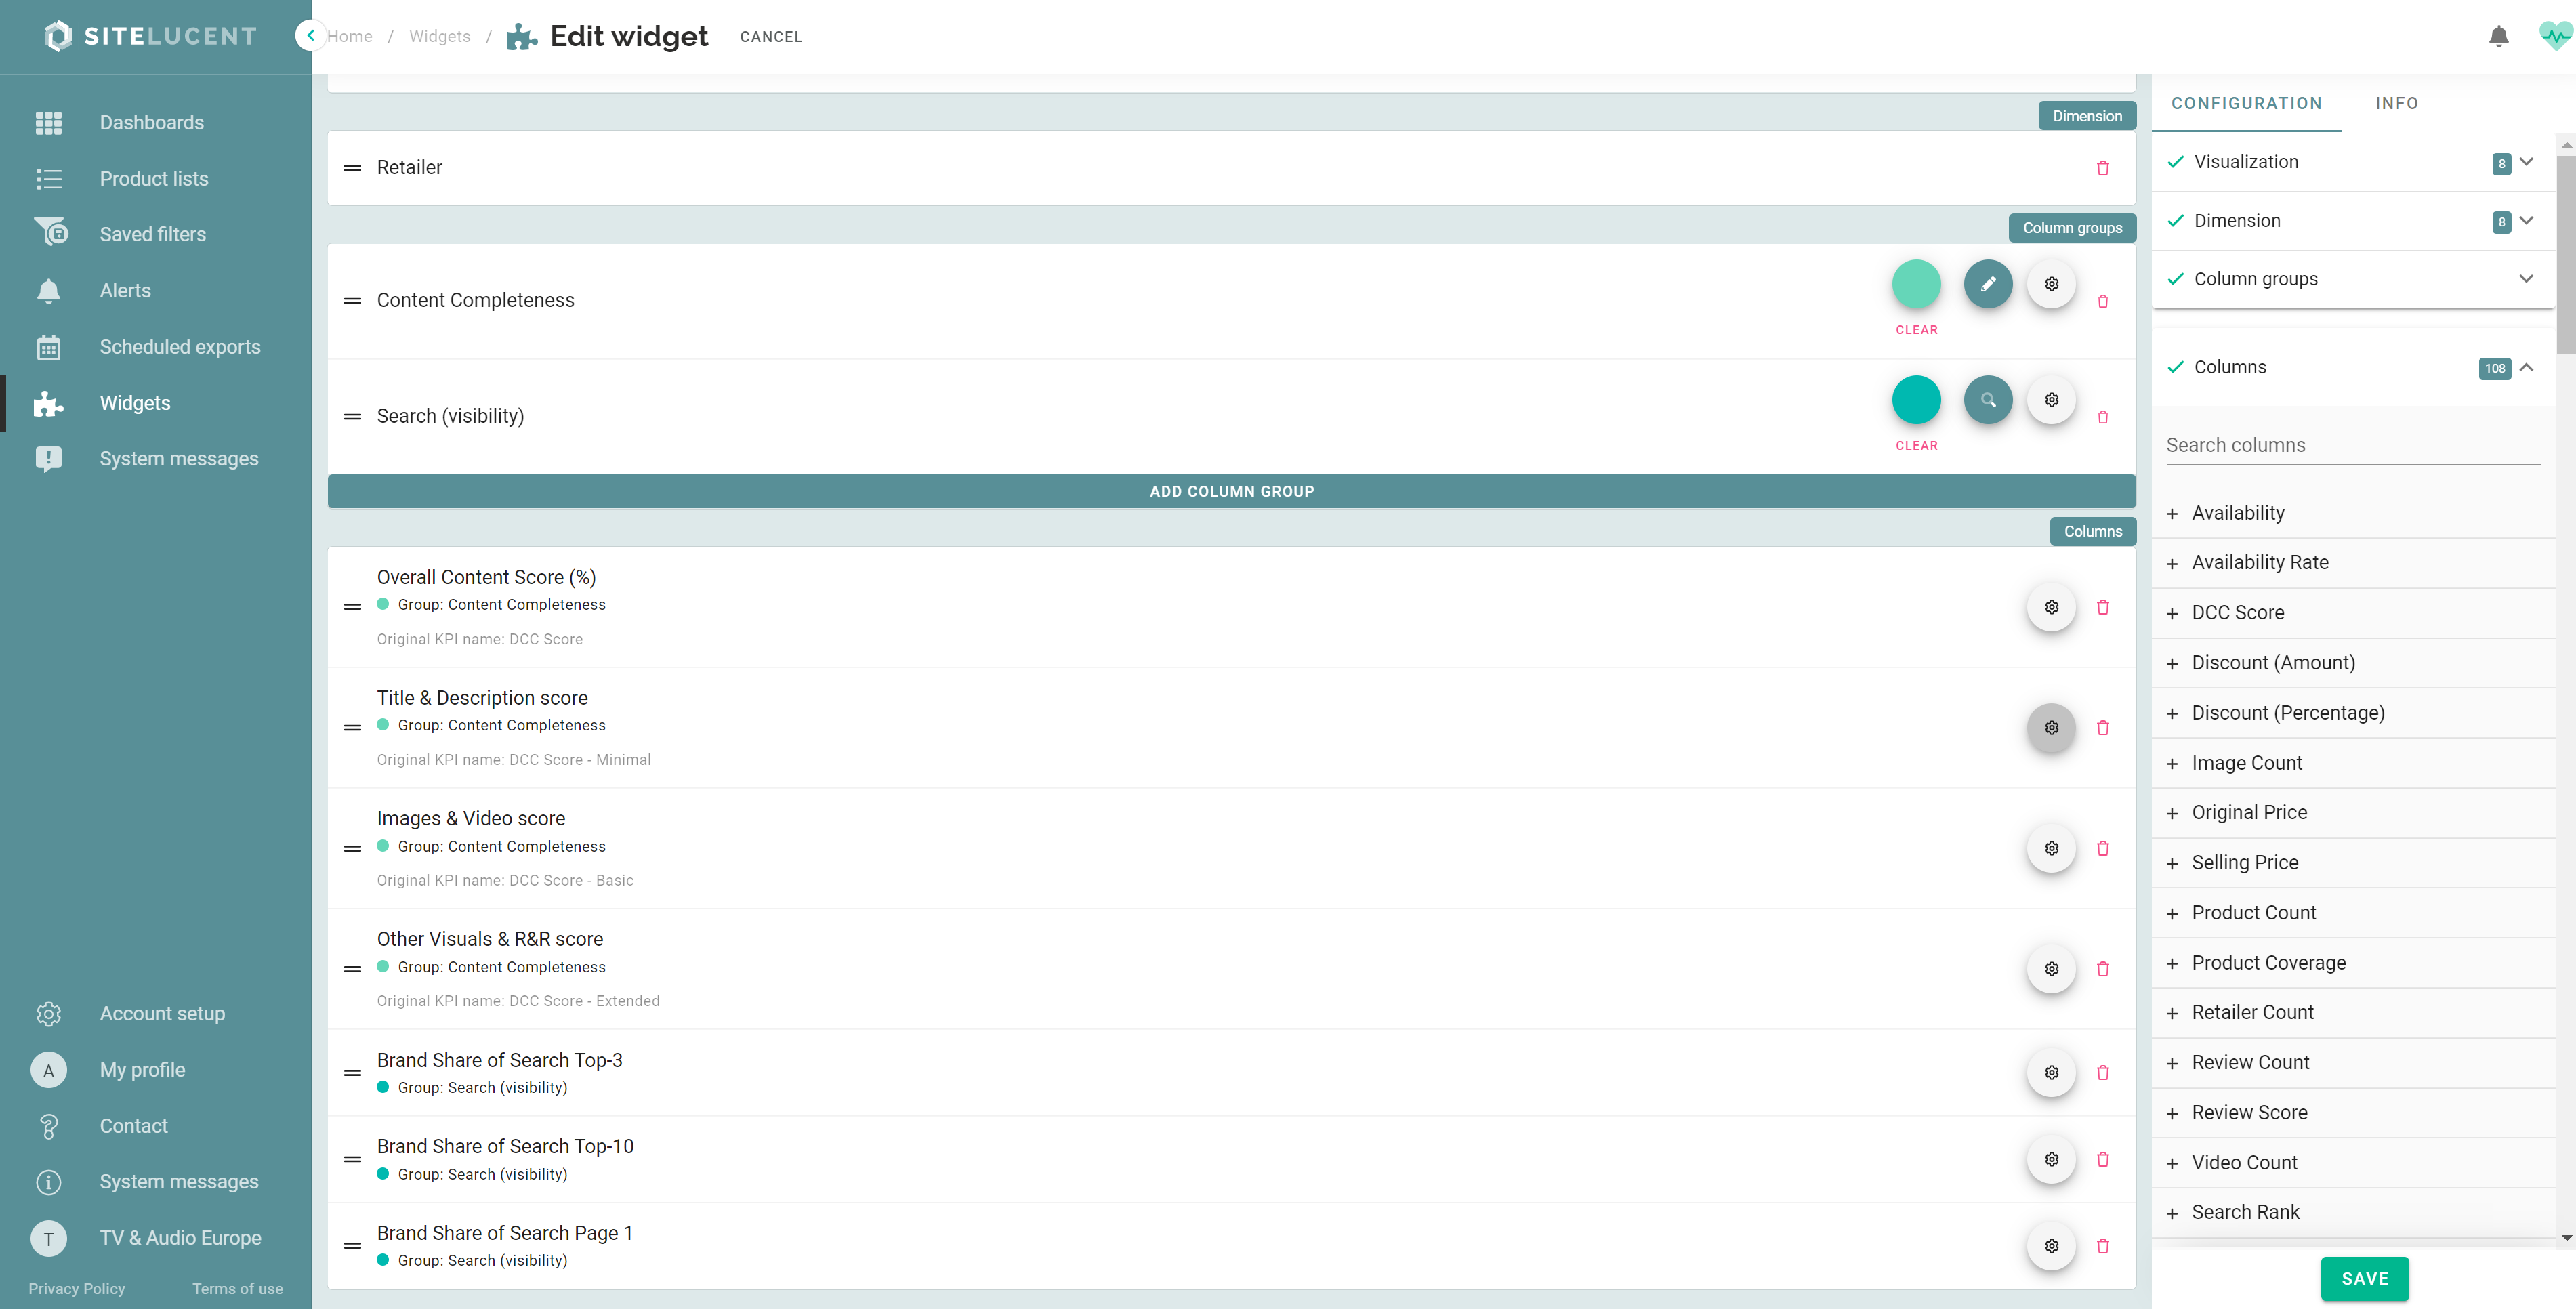
- Once the column groups have been created, you can start adding columns/metrics of your choice. Use the search bar to quickly search for a metric.
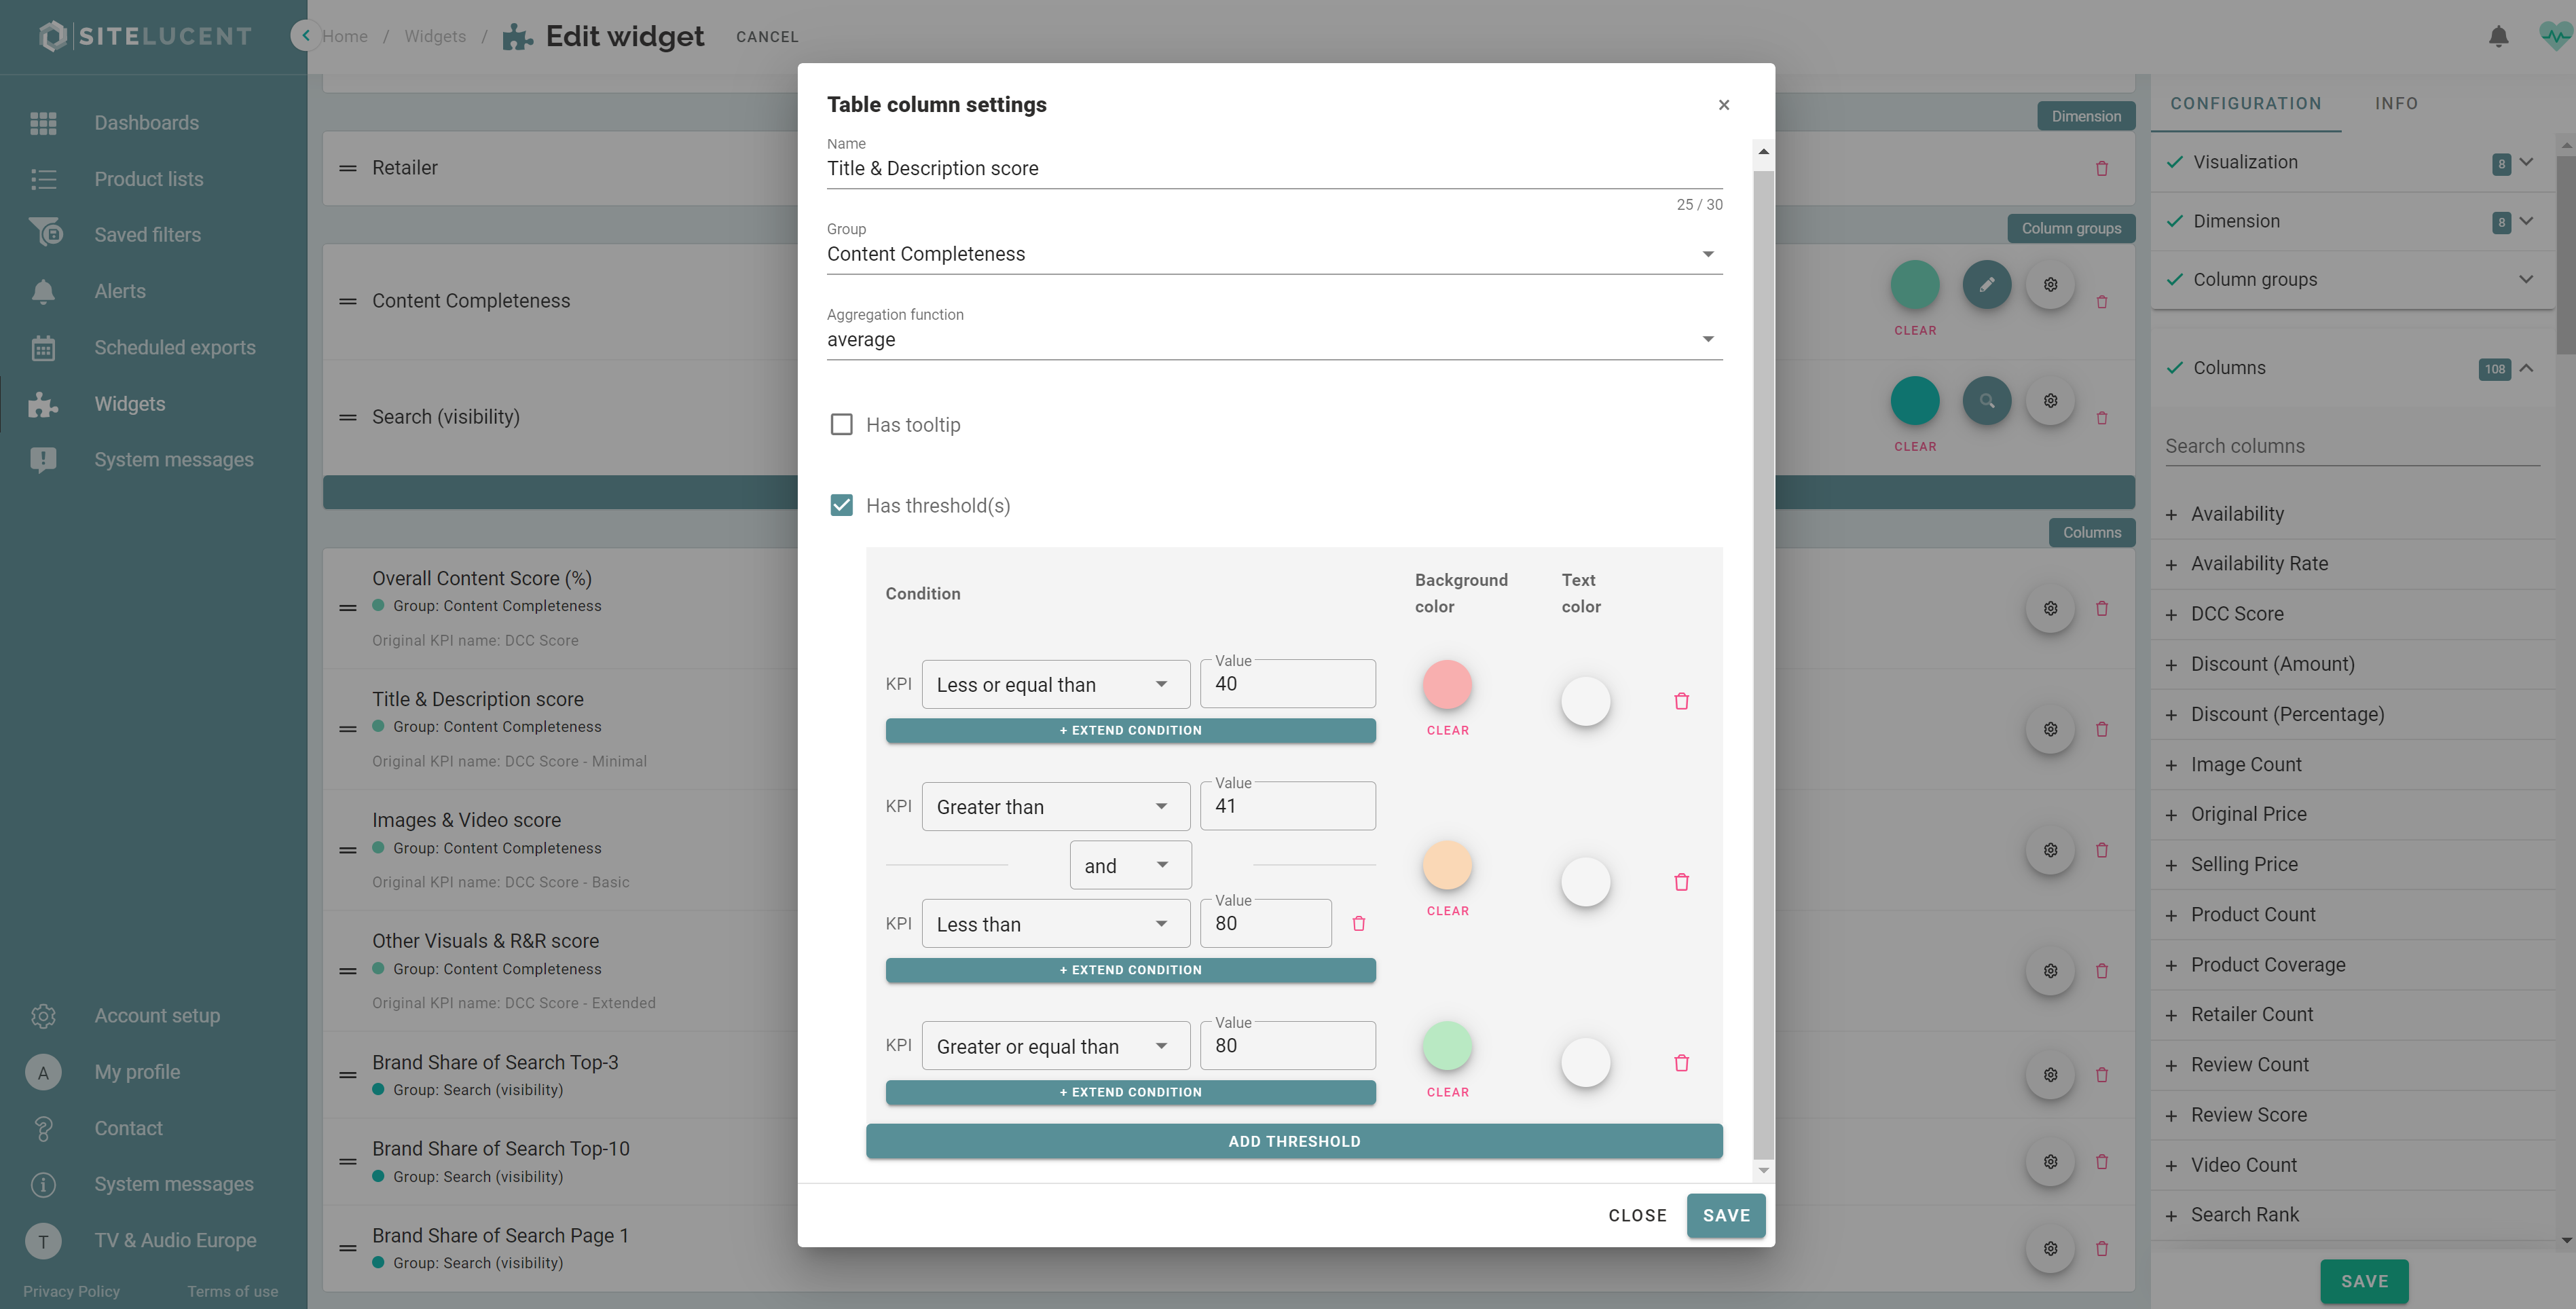
- Then click the gear wheel icon ⚙️to choose the associated column group and aggregation function.
- Additionally, you can set up a tooltip/hover text, and conditional coloring by selecting 'Has threshold(s)'.
- When done, click 'Save'.
- Repeat the above steps until you have all desired columns in your performance overview.
- Switch in the upper right corner to the info tab and give your widget a name + optional description.
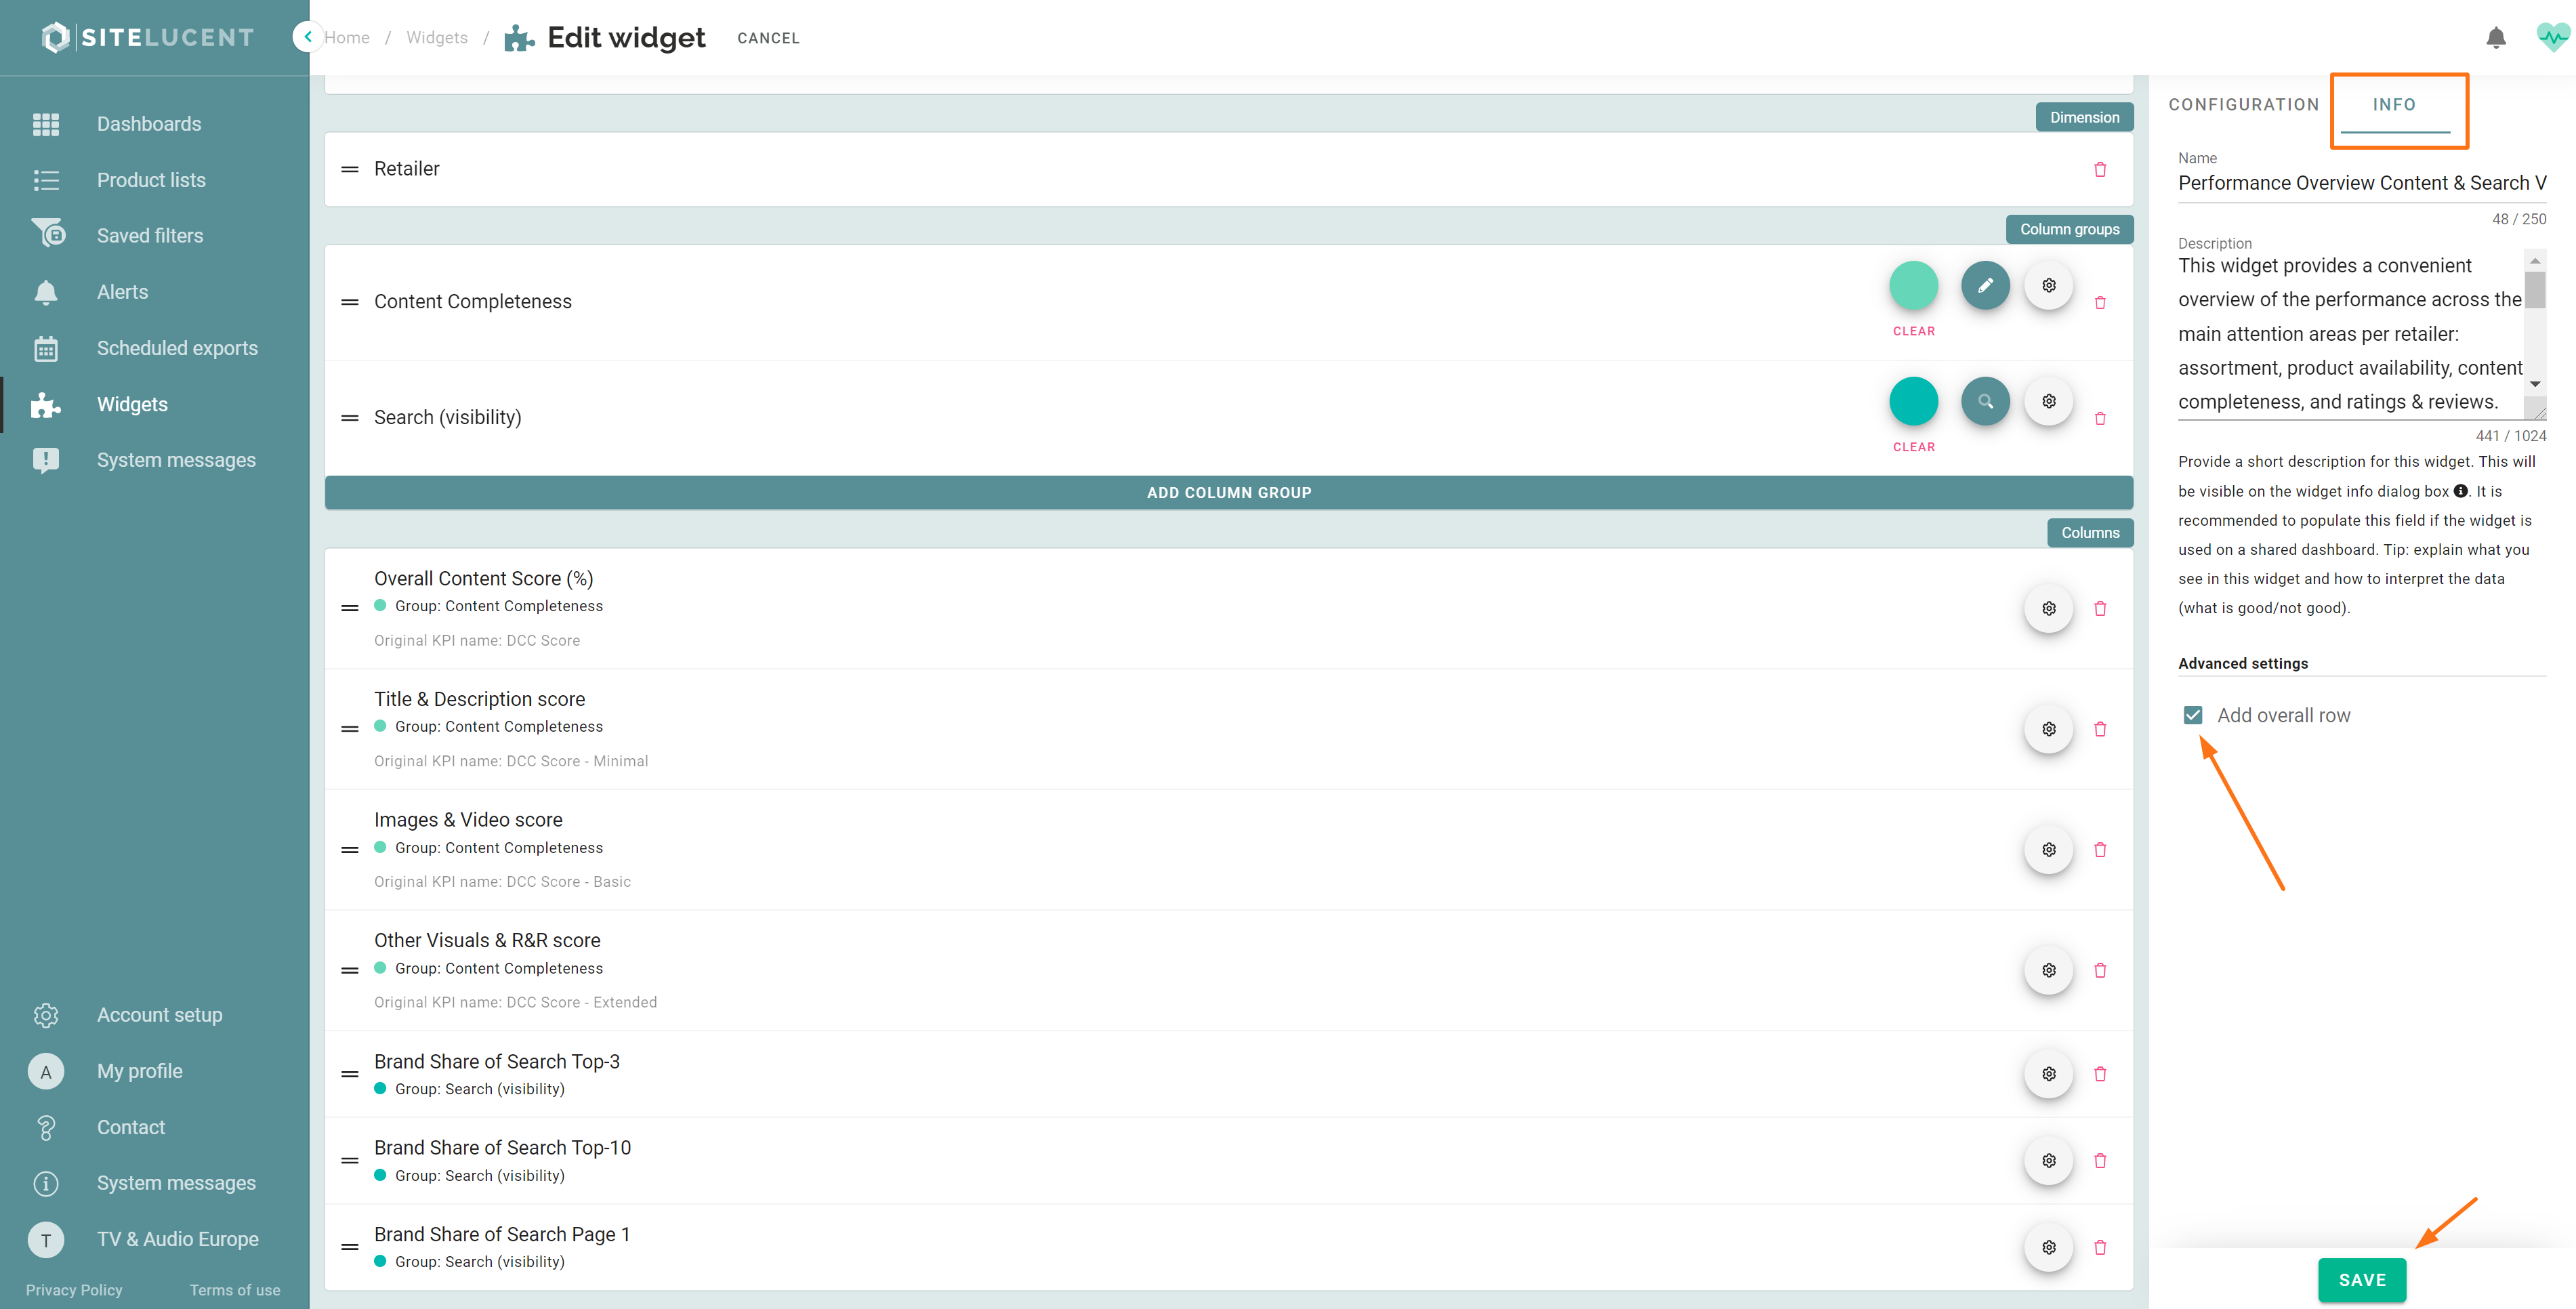
- Select the 'Add overall row' checkbox if desired.
- Then click 'Save'.
- You have now created your own Performance Overview Widget.
- The final step is to add the widget to a dashboard.