In this article we will walk you through the Performance Overview Dashboard
In this article, we walk through our main dashboards and give you the tools you need to make the most of your digital shelf data.
The following topics are covered in this article:
- What is the Performance Overview?
- Conditional coloring explained
- Assortment
- Product Availability
- Product Content
- Ratings & Reviews
- Customize your Performance Overview
- Compare date ranges in the Performance Overview
- Dimensions in the Performance Overview
- Linked dashboards in the Performance Overview
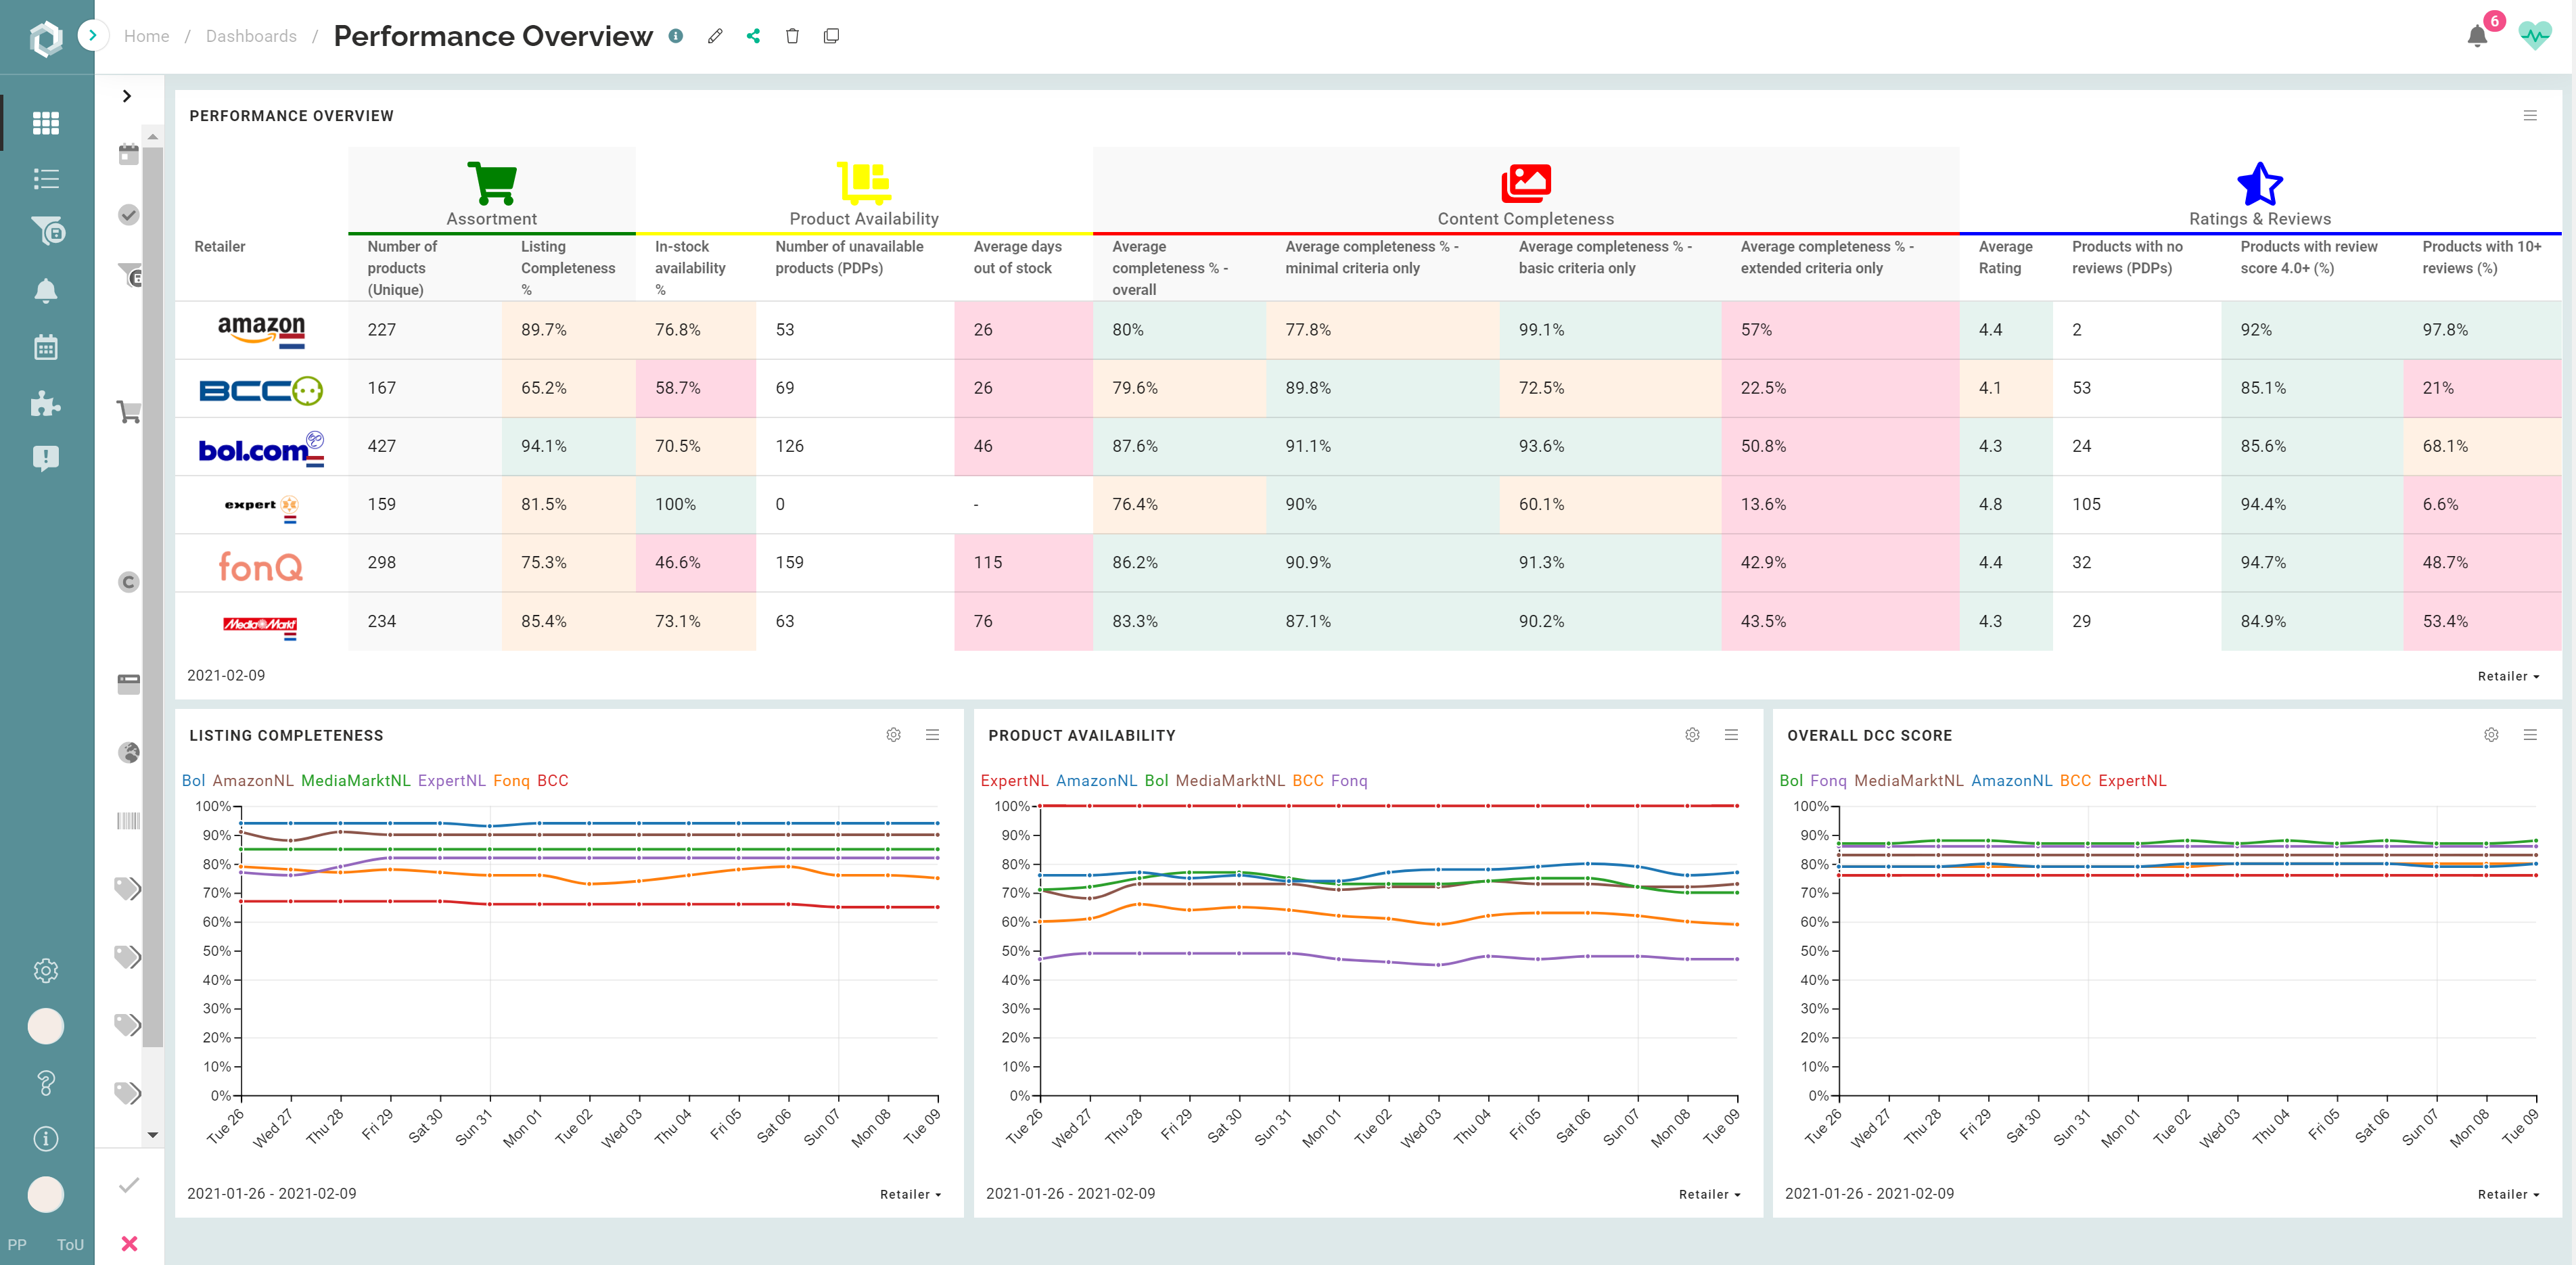
What is the Performance Overview?
The purpose of the Performance Overview is to give you an overview on your main KPIs in one glance. The conditional coloring in combination with the dashboard clickthrough makes it possible to get aware of, and if needed quickly deep-dive into, underperforming products.
To open the dashboard, you first:
- Navigate to dashboards > Performance overview
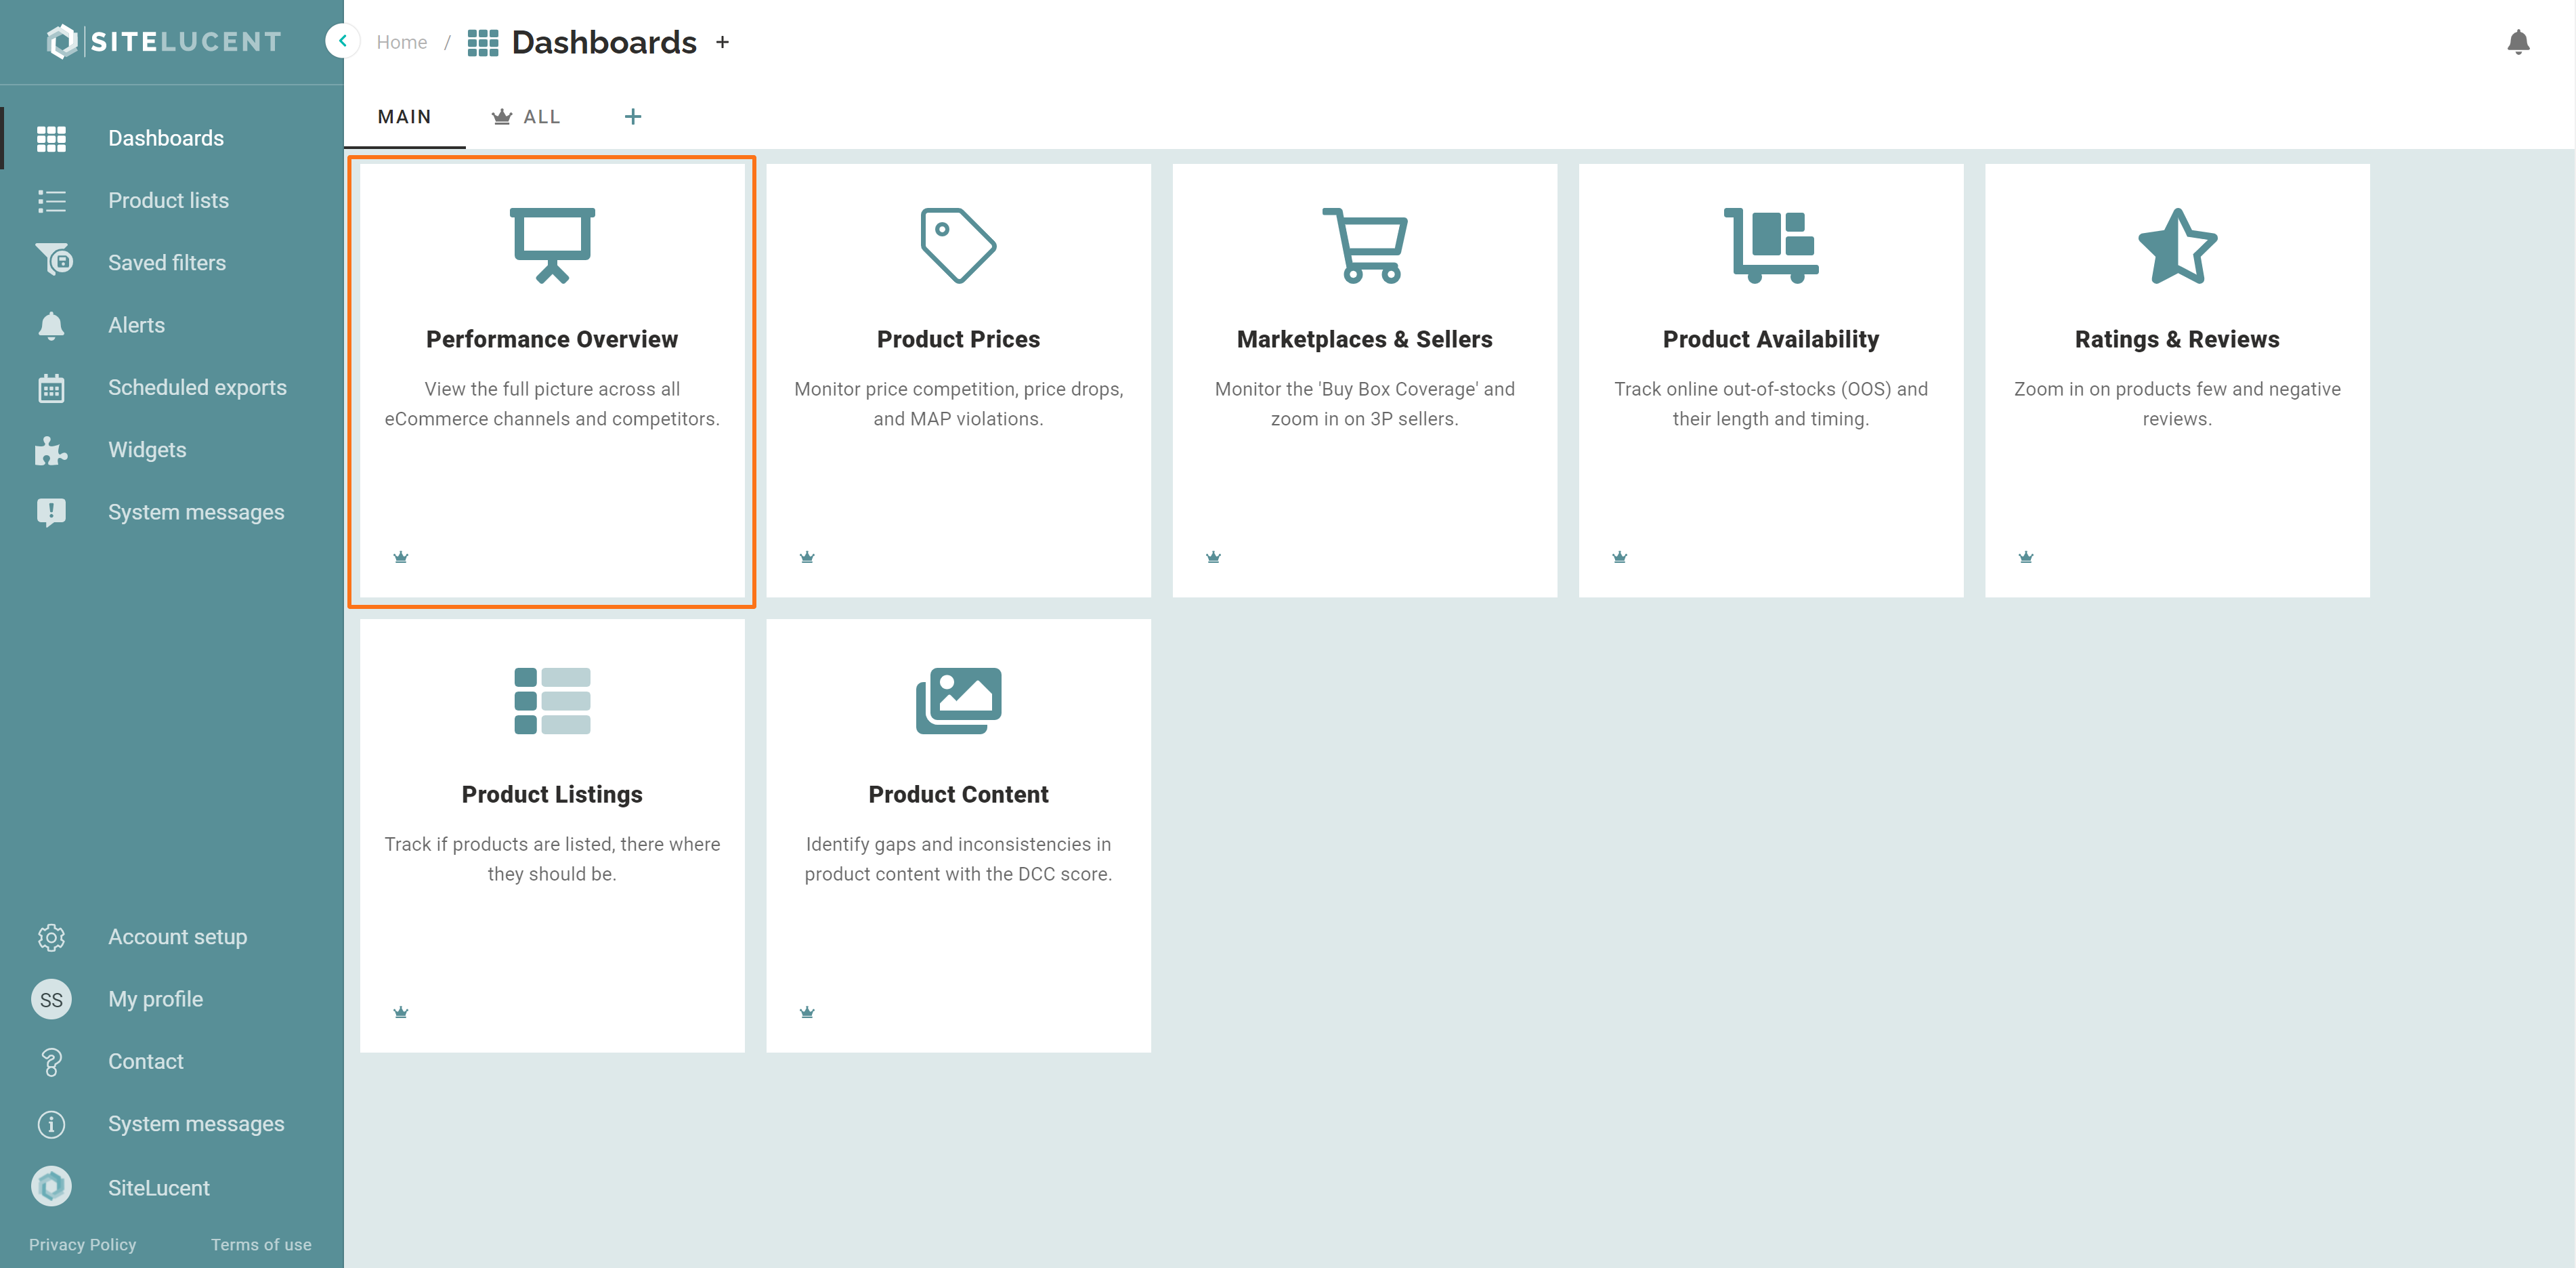
- By default, the performance overview dashboard looks as follows:
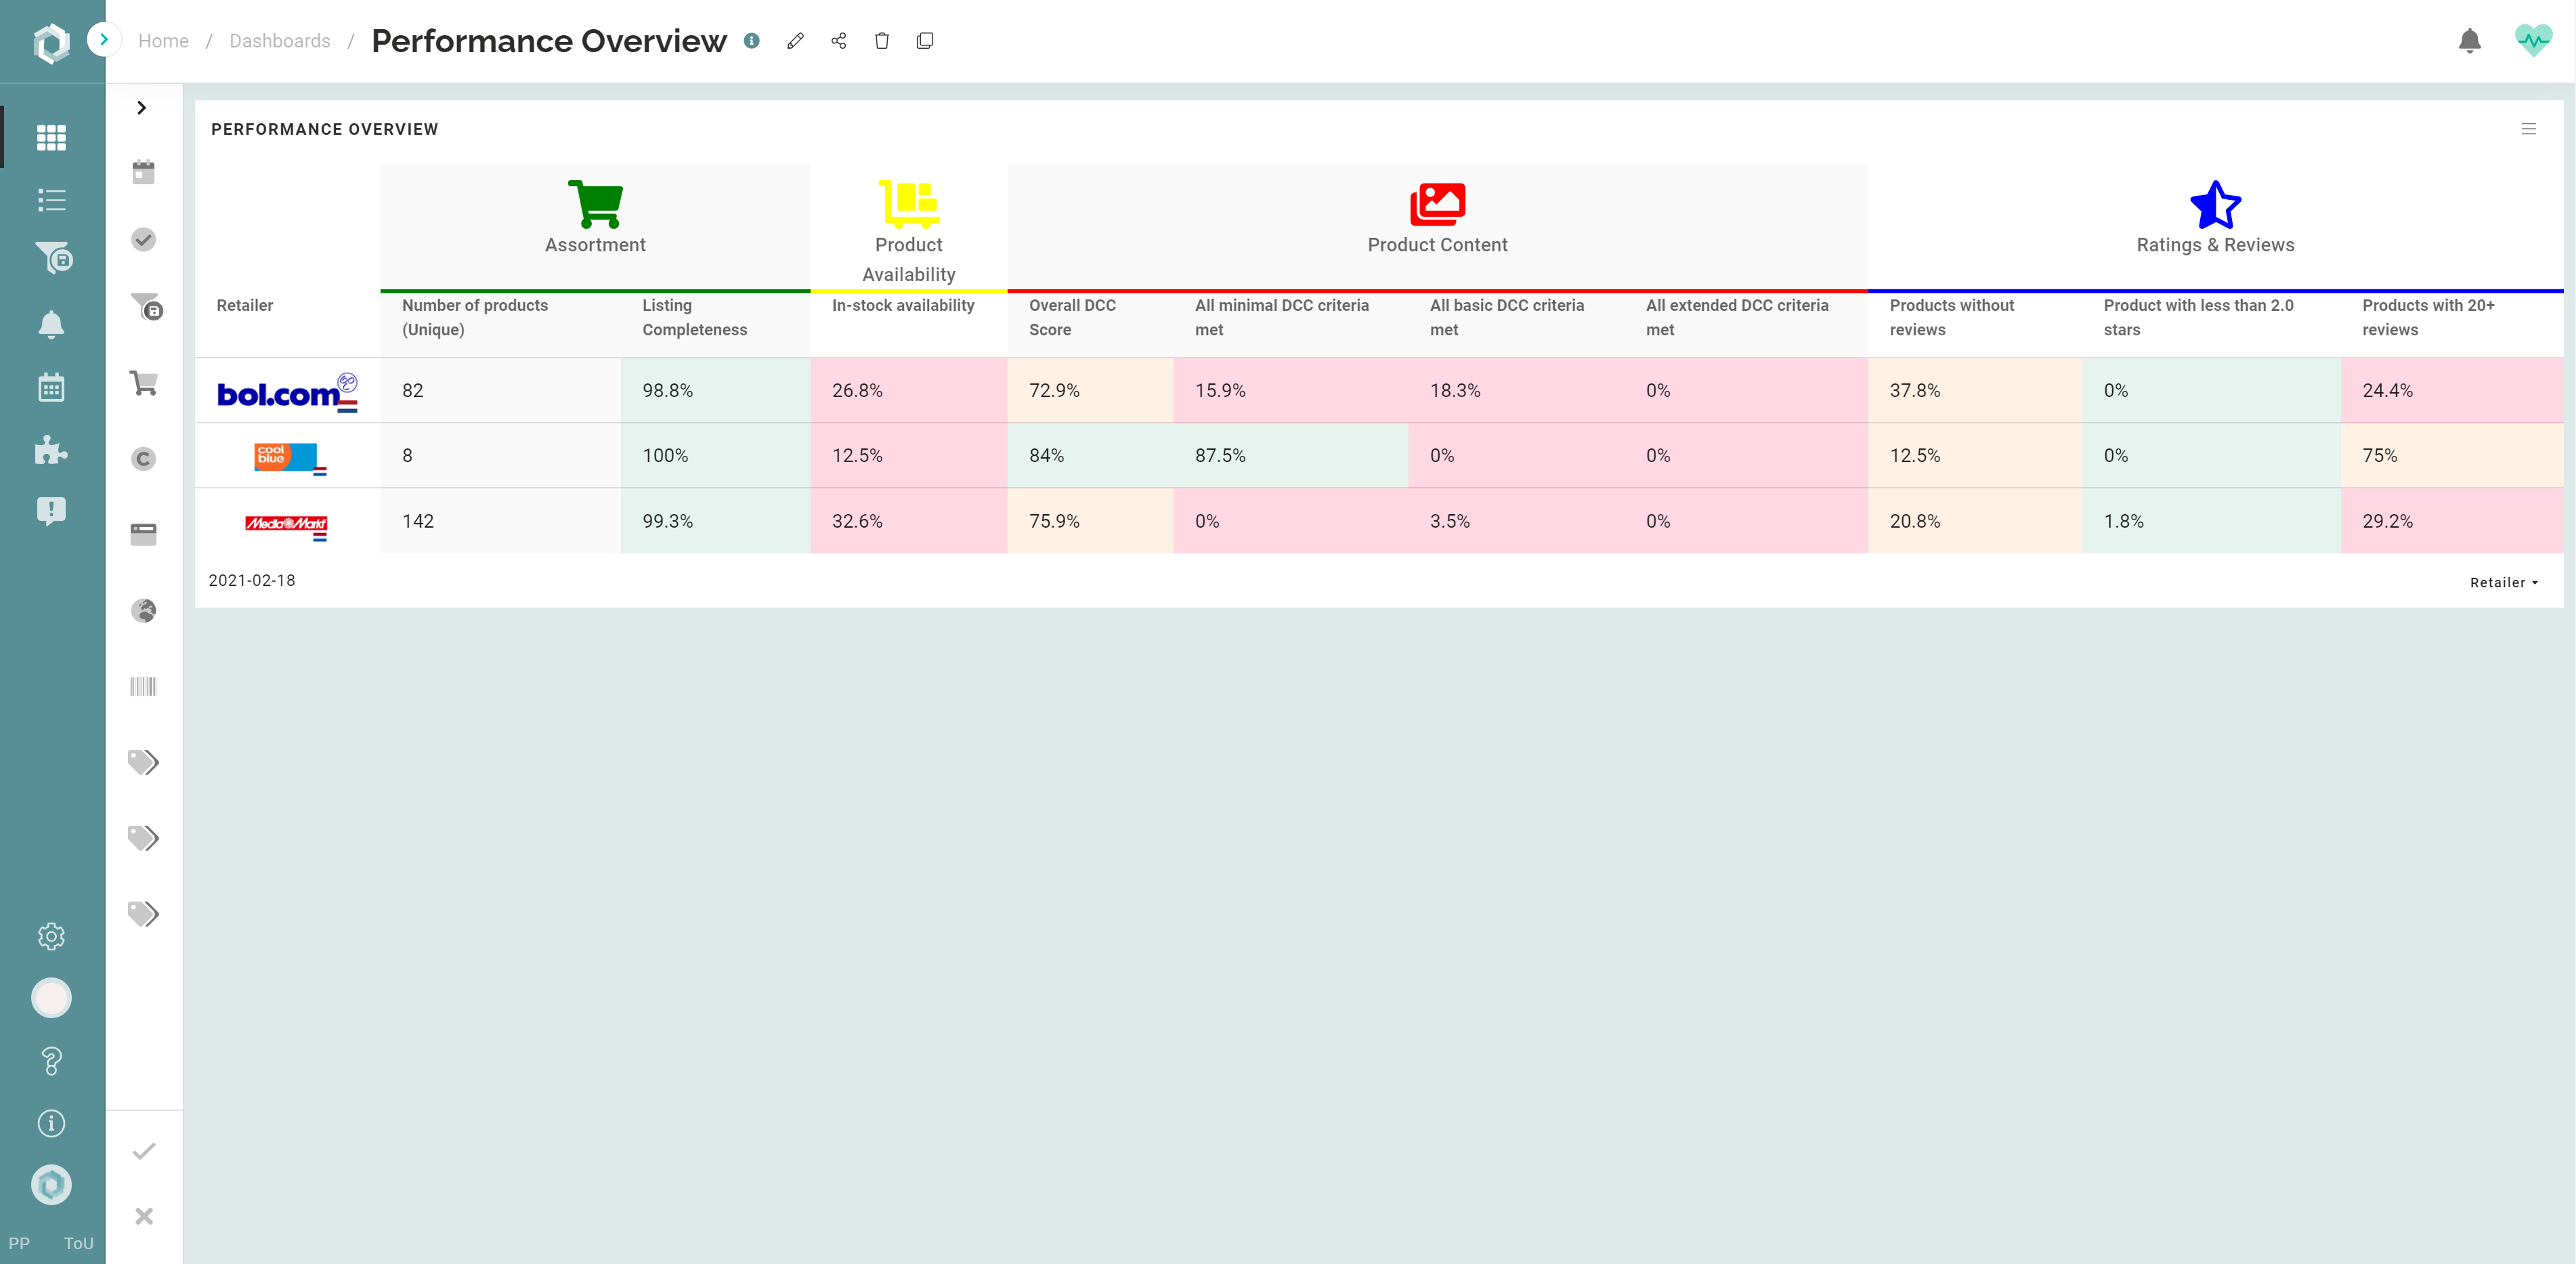
- On the left hand you see all retailers selected in the filter menu. In the example above we see 3 retailers: bol.com, Coolblue, and MediaMarkt.
- For each retailer we can see main KPIs, divided into topics.
- You can switch dimension by clicking the bottom right menu in the widget, to see the Performance Overview by Brand, Seller, or Country.
- Click the icons to navigate to the related topic-dashboard and view more detailed widgets.
Conditional Coloring Explained
By default the conditional coloring rules are as follows:
- Content Completeness & Availability ---> values at or above 90% are shown Green, between 65% and 90% are Yellow, and lower than 65% are Red.
- Days out of stock ---> values up to 3 days are shown in Green, between 4 and 15 days in Yellow, and above 15 days are Red.
- DCC-related metrics --> values at or above 80% are shown Green, between 60% and 80% are Yellow, and lower than 60% are Red.
- R&R ratings/stars --> values at or above 4.3 stars are shown in Green, between 3.5 and 4.3 in Yellow, and below 3.5 stars are Red. All %-values same as DCC.
Check out this article to find out how you can add or edit conditional coloring to your performance overview.
Assortment
Within the Assortment topic we find the:
- The total number of unique products found per retailer, and the Listing Completeness.
- In order to see a realistic figure on Listing Completeness, it is needed to upload a product list first in which you define your assortment. In case you have a retailer-specific assortment, also upload a retailer assortment.
- When using a retailer assortment, make sure you enable the retailer assortment switch in the view filter menu (see image below).
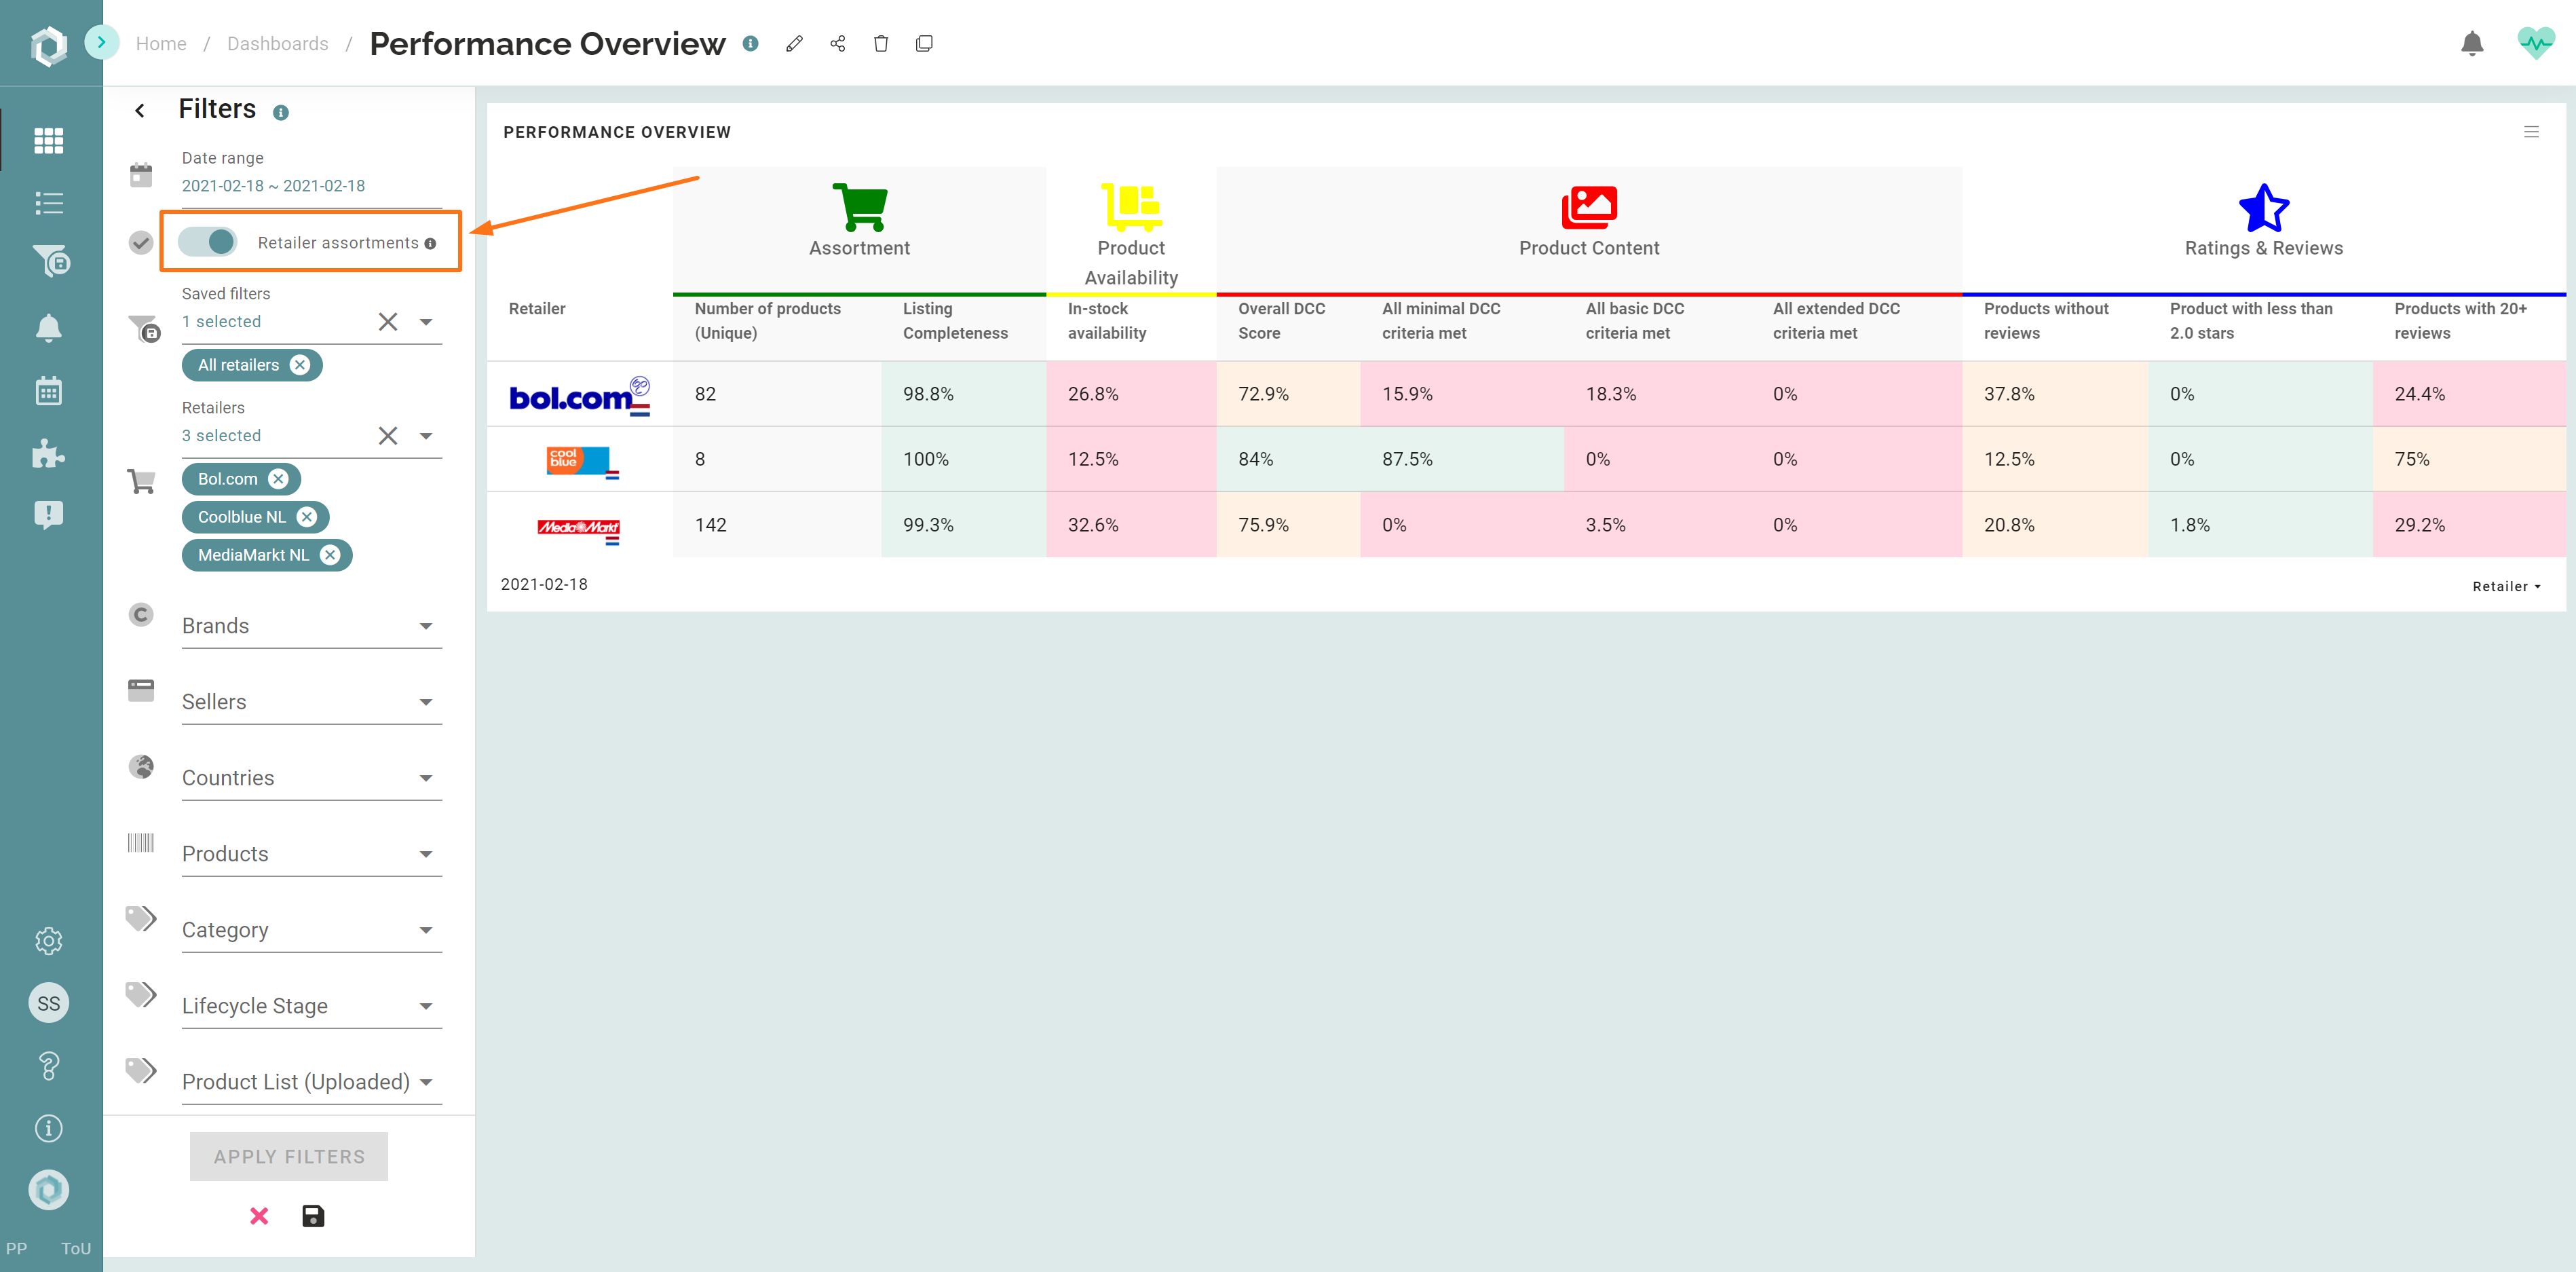
- When clicking the 'Assortment-icon' you click through to the product listing dashboard, where you can dive deeper into the data.
Product Availability
Within the product Availability topic we find the:
- In-stock availability rate: The percentage of products available within the total portfolio that we found online.
- When clicking the 'product availability-icon' you click through to the product Availability Dashboard, where you can dive deeper into the data.
Product Content
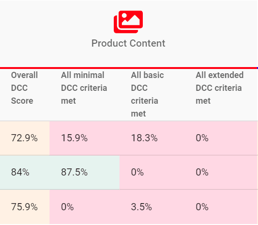
Within the product Product Content topic we find the:
- Overall DCC score
- All minimal DCC score criteria met
- All basic DCC score criteria met
- All extended DCC score criteria met
Read more about the DCC score here: What is a DCC score and how is it calculated?
- When clicking the 'product content-icon' you click through to the product Content Dashboard, where you can dive deeper into the data.
Ratings & Reviews
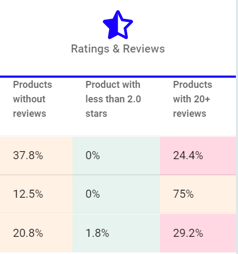
Within the product Ratings & Reviews topic we find the percentage of products:
- Without reviews
- With less that 2.0 stars
- With 20+ reviews
When clicking the 'ratings & reviews-icon' you click through to the Ratings & Reviews Dashboard, where you can dive deeper into the data.
Customize your Performance Overview
How to customize?
- We can add or remove KPIs from the data table.
- We can adjust de criteria for conditional coloring.
- We can set clickthrough's to dashboards of your choice.
Contact us if you wish to make any changes to the Performance Overview table in your account.
- You can add trend charts below to see how main KPIs evolve over time. How? Check it here: How to add widgets to a dashboard
Compare date ranges in the Performance Overview
In the filters, you can compare date ranges.
- Click on the 'Date range' in the filters

- Here you can choose the date ranges you want to compare.
%20(24).png?width=688&name=Releases%20(1200%20x%20300%20px)%20(24).png)
- Click 'Apply filters' to compare the date ranges in the performance overview.
- In the Performance Overview, you now see the difference between the two periods in percentage points.
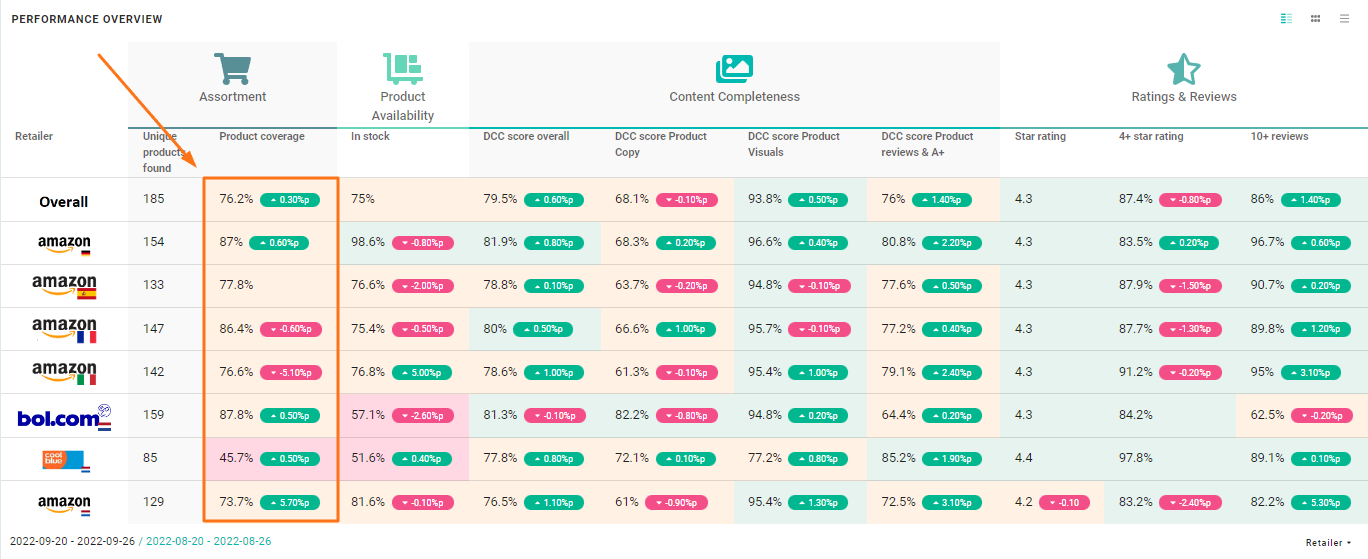
- Green shows an increase, and red shows a decrease.
- You can export this information as an Excel of CSV file, or as an image to use in reports via the hamburger menu
 in the widget.
TIP: Hover over the red and green percentage points to see the score from the previous period.
Dimensions in the Performance Overview
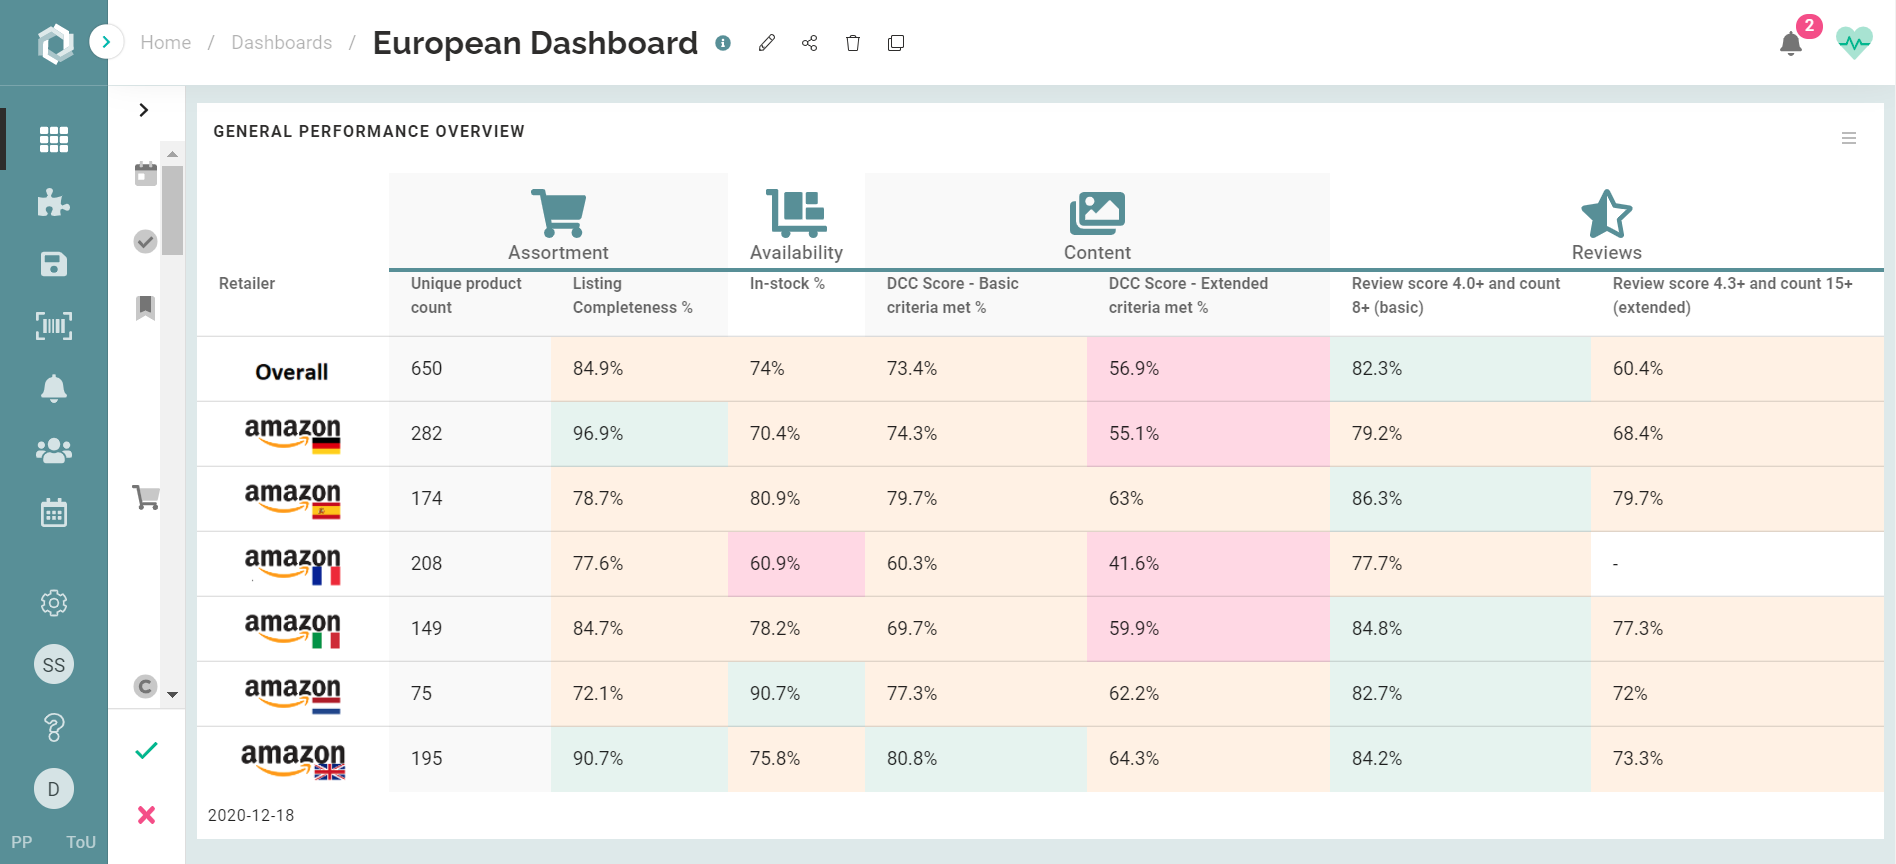
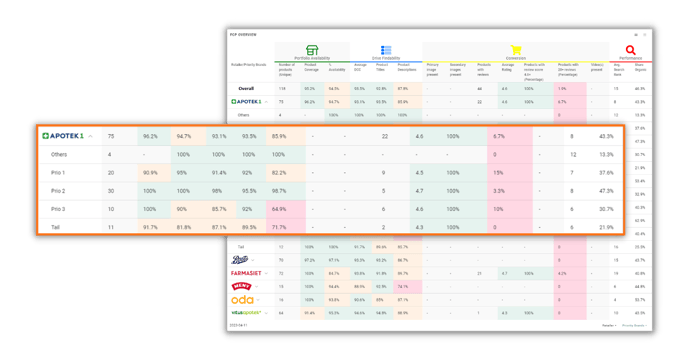
It's possible to edit the dimension of all your widgets, including the performance overview. This allows you to switch between retailer, brand, or country level. If you added tags to your product list, you can also use those tags as dimensions.
In the Performance Overview, you can also set a sub-dimension. Here you can also use tags from your product list as a sub-dimension. For example, you've set your Performance Overview with the retailer dimension, and you combine it with your priority brands as a sub-dimension. Simply by opening your dimensions, you see the data for your sub-dimensions.
To set a sub-dimension, you:
- Go to your Performance Overview dashboard
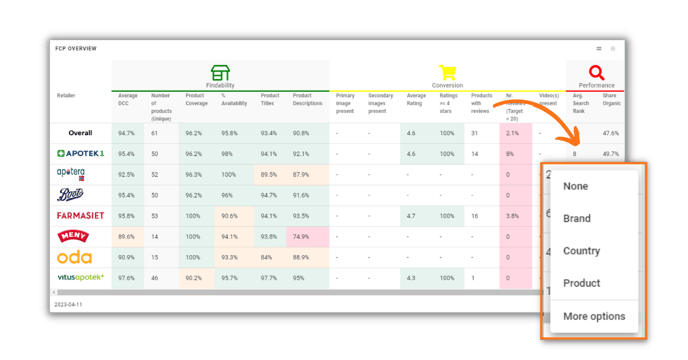
- At the bottom right of your widget, you can choose a dimension and subdimension;
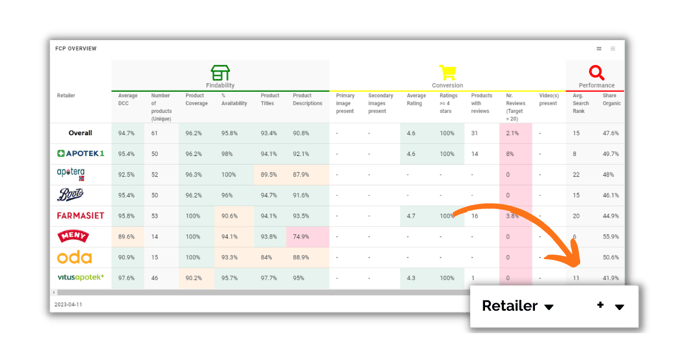
- By clicking on the '+' icon, you can choose a standard subdimension or choose one of the tags used in your product lists;
- By choosing the sub-dimension, a second layer will be added to your widget.
You can change the dimensions per widget every time you enter the dashboard, but it's also possible to set a dimension and sub-dimension as a saved dimension for your dashboard.
- Click on 'Edit dashboard' at the top of your Performance Overview dashboard
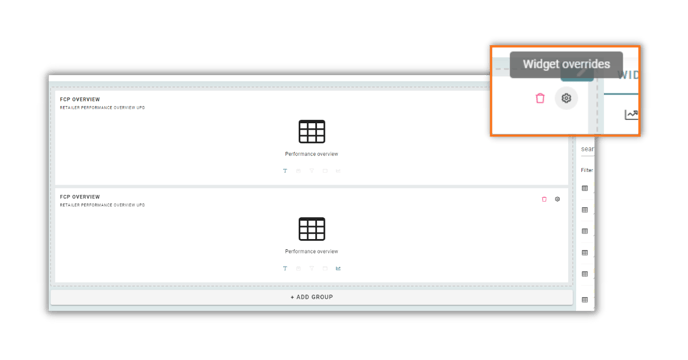
- Click on the wheel 'Widgets overrides'
- Open 'Dimension', and choose the dimension and sub-dimension you want to have saved as a standard
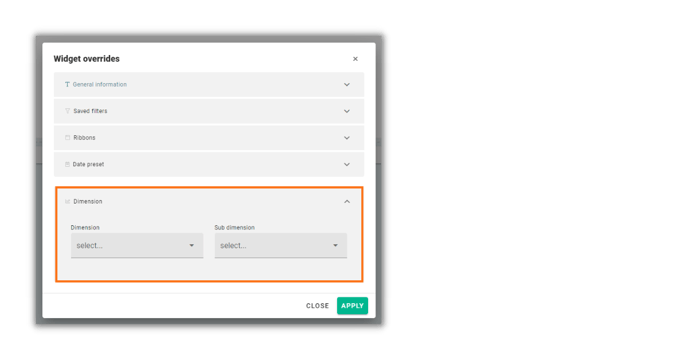
- Click 'Apply'
- To finish, click 'Save' at the bottom right of your screen.
Linked dashboards in the Performance Overview
You can customize the dashboards that are linked in the Performance overview.
- Navigate to your Performance Overview dashboard;
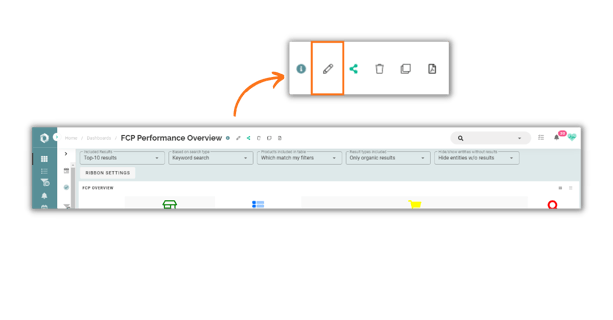
- Click the pencil icon ✏️ at the top of your dashboard to edit the dashboard;
- Click the wheel on the right to go to 'Widget overrides';
- Here you can customize the linked dashboards.
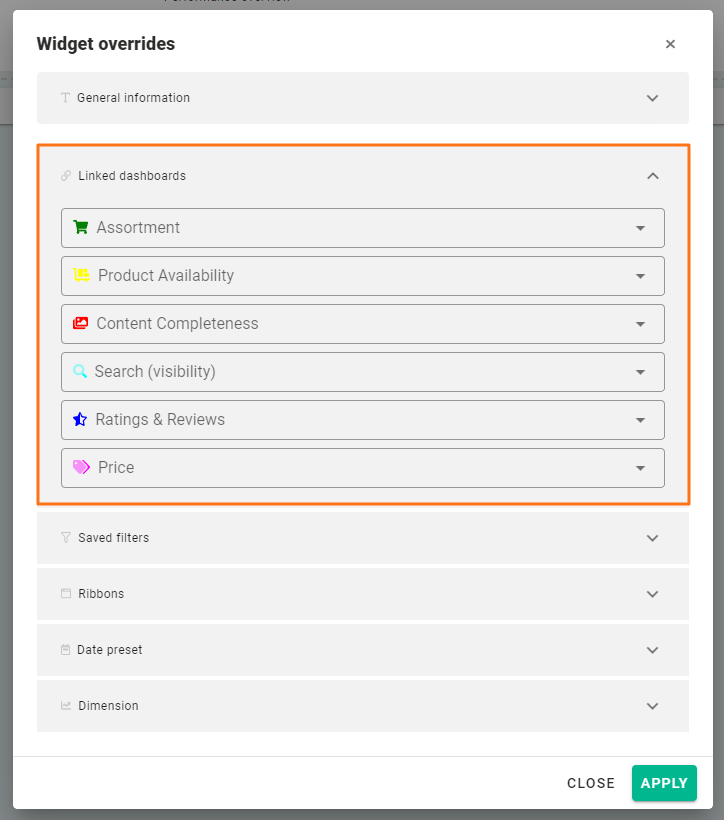
- Click 'Apply' after you've customized the dashboards;
- Don't forget to click 'Save' in the bottom right corner to finalize your settings.