SiteLucent Release Notes
.png?width=555&name=Release%20notes%20(2).png)
CHECK OUT OUR LATEST UPDATES
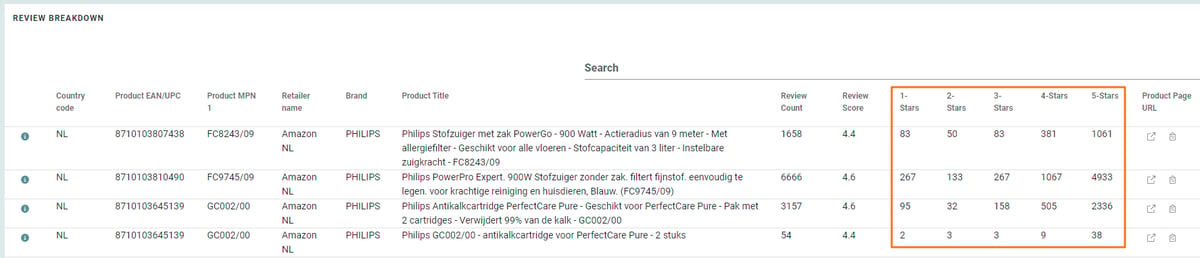
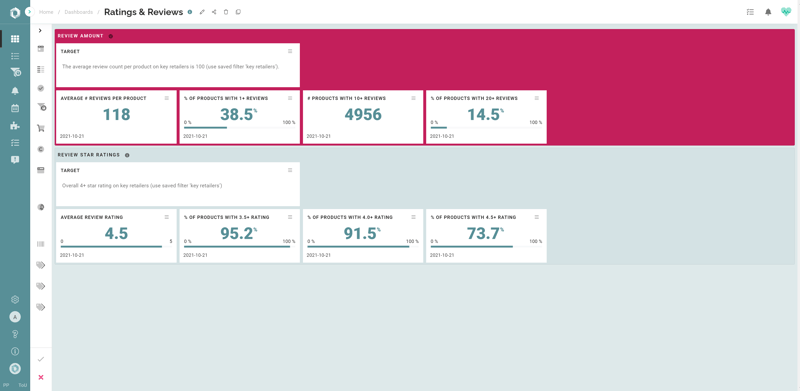
NEW: Review Breakdown
You probably already know about our review module. With our review breakdown, you can monitor how star ratings are divided.
Contact your customer success manager for more information!
IMPROVED: Cleaner widget tables
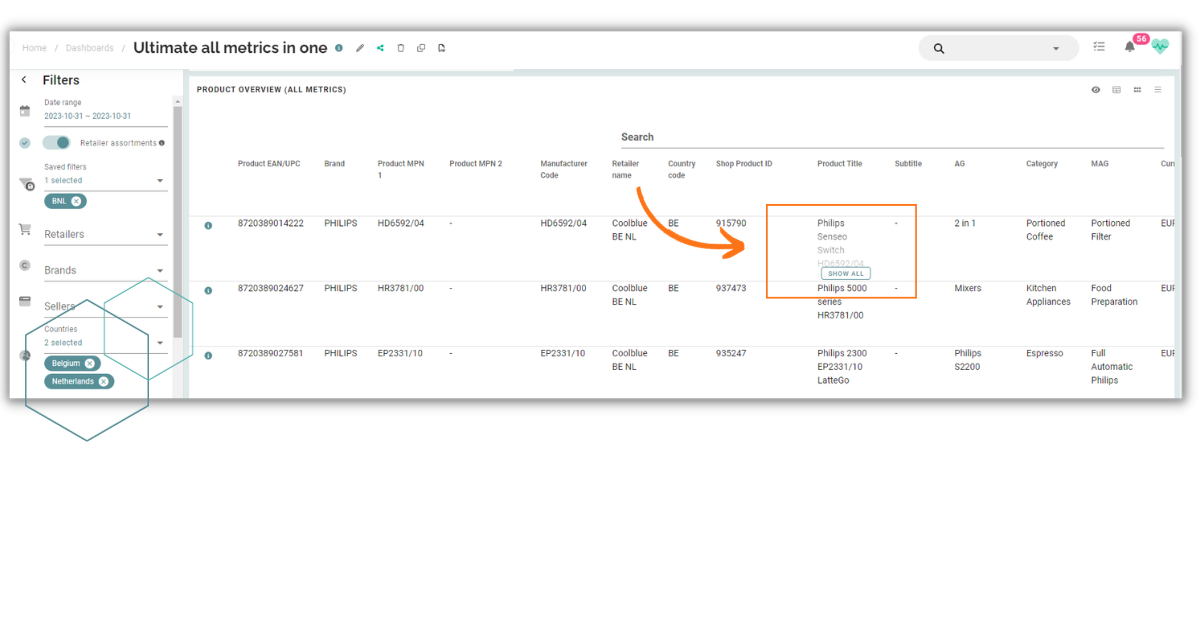
Maybe you've already seen it, but our data tables now have a much cleaner look. Large amounts of data are collapsed, and we've added a "Show all" button.
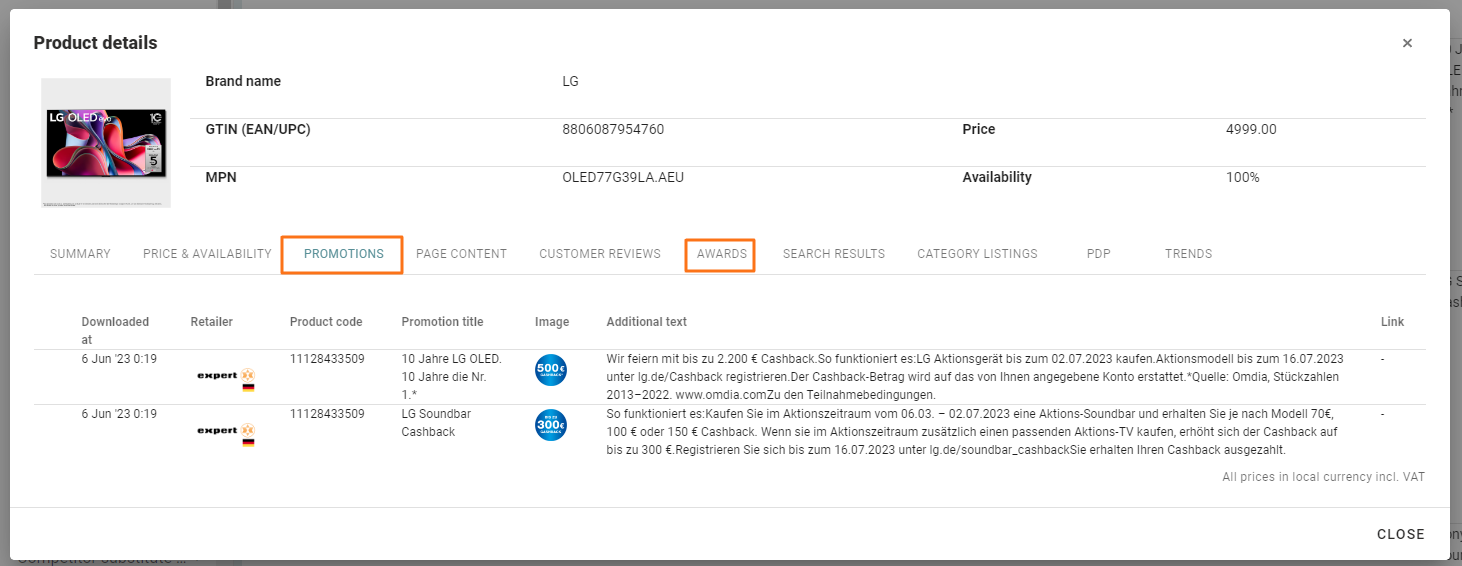
NEW: Promotions and awards in the product details tab
In the Product Details tab, you can now see promotions details and awards that are visible on your product detail pages.
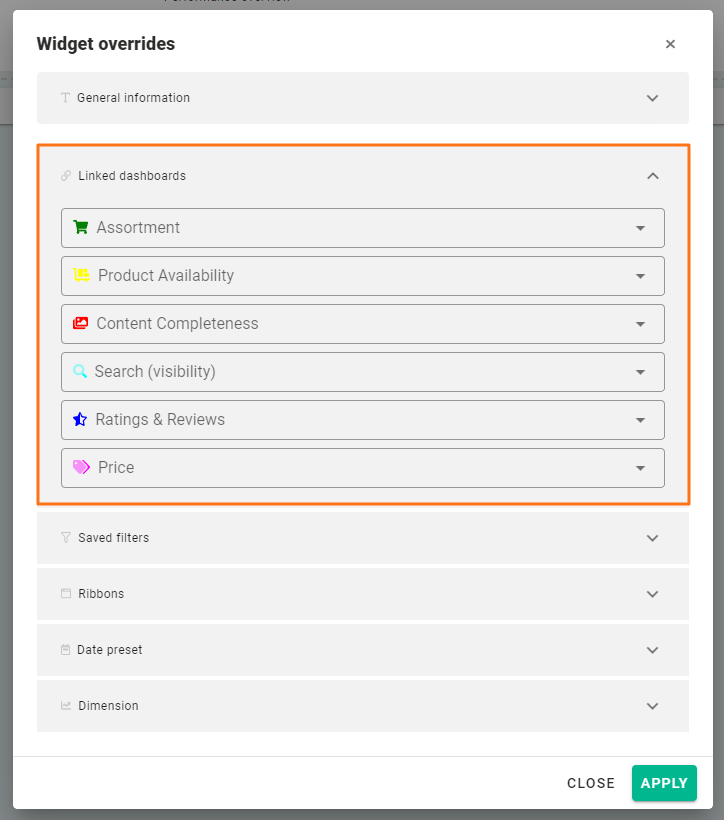
NEW: Customize linked dashboards in the performance overview
You can customize the dashboards linked in the Performance Overview to whatever works for you. Go to our help center to find out how it works!
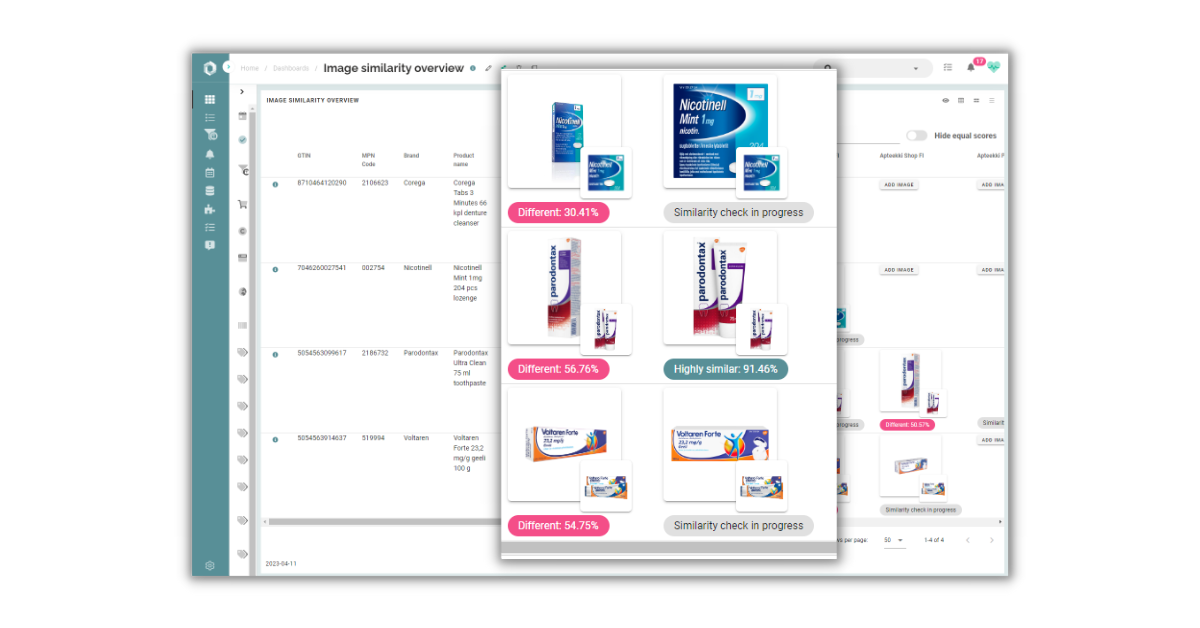
NEW: Image Similarity Module
Are you still manually checking if your retailers uploaded product images with the new packaging? Our image similarity module shows you instantly where images match, and where they don't.
Contact your Customer Success Manager for more information!
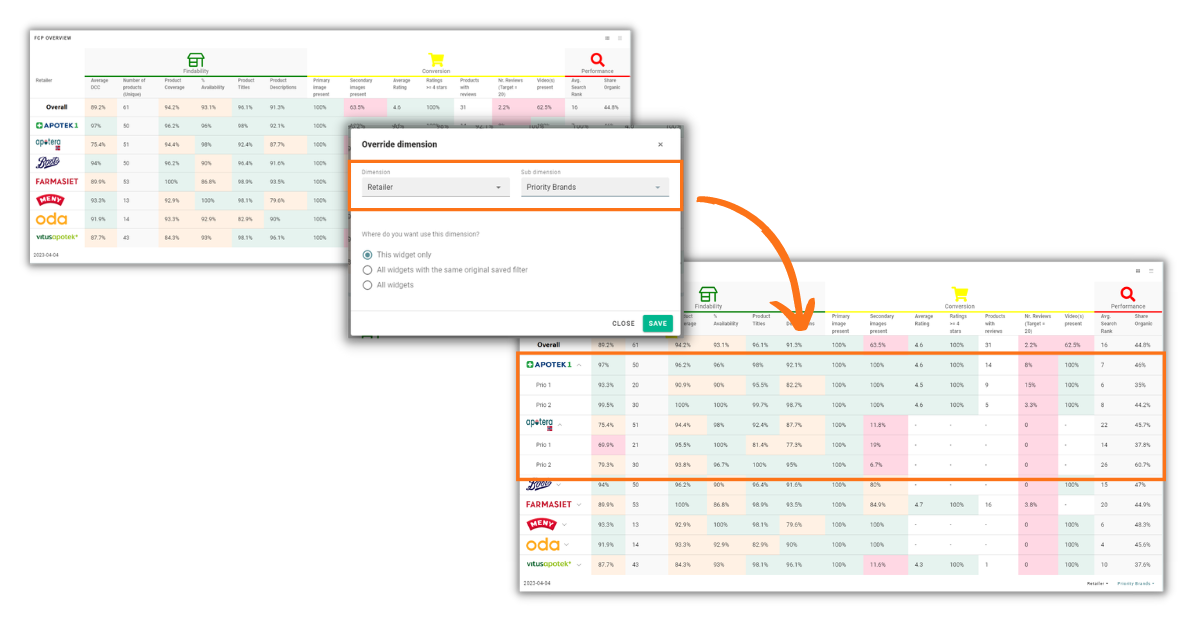
NEW: 2-layer Performance Overview
As you know, it's possible to edit the dimension of all widgets, including the performance overview. But you can now add a sub-dimension, giving you a layered performance overview where you can see more data at a glance.
For example, you've set your performance overview with the retailer dimension, and you combine it with your priority brands. These sub-dimensions are linked to the tags you use in your product lists. Simply by opening your dimensions, you see the data for your sub-dimensions.
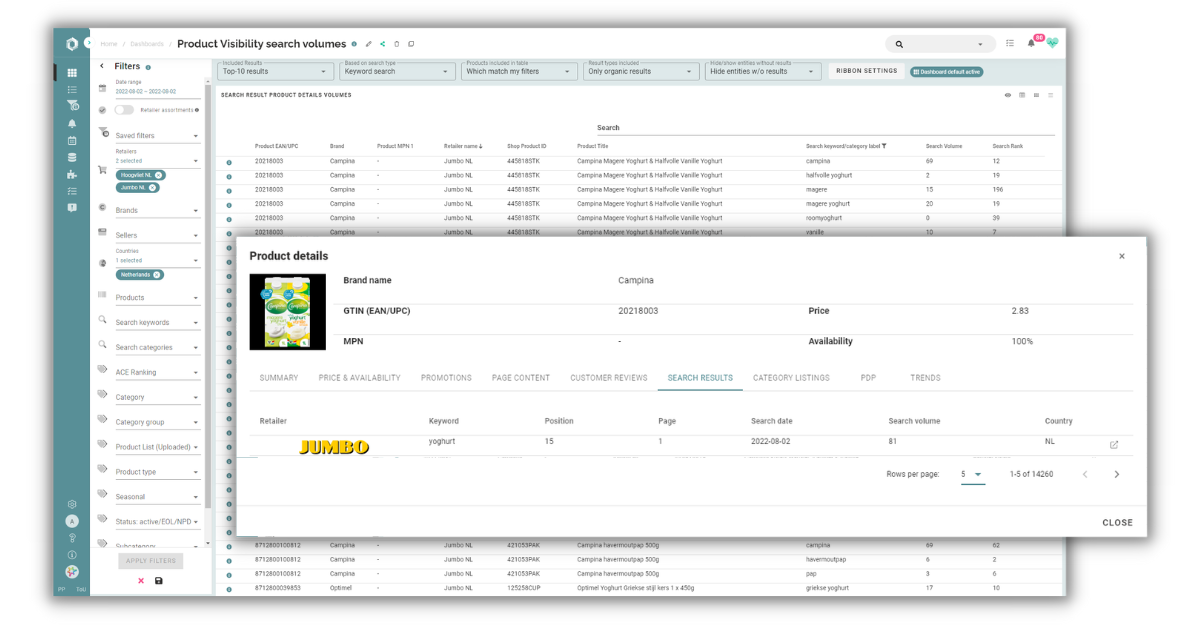
NEW: Add search volumes to your Product Visibility dashboard
It was already possible to monitor your search rankings in the Product Visibility dashboard. In this dashboard, you can now add search volumes to your widgets to get a complete overview of your products on the digital shelf.
Contact your customer success manager for more information!
NEW: Image Similarity Module
Are you still manually checking if your retailers uploaded product images with the new packaging? Our image similarity module shows you instantly where images match, and where they don't.
Contact your Customer Success Manager for more information!
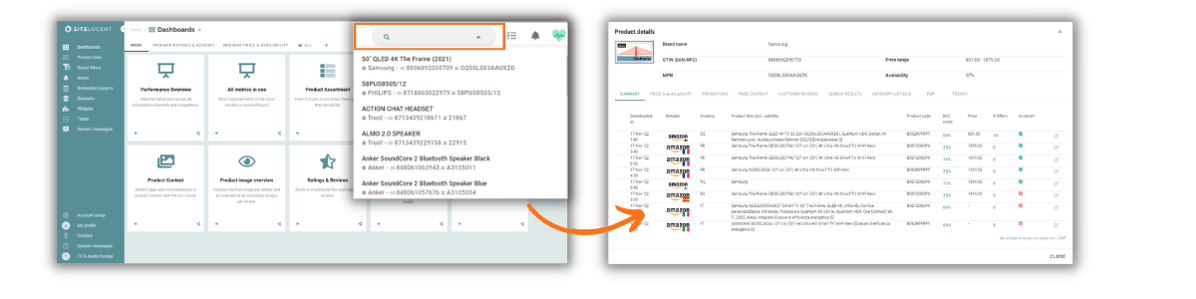
NEW: Search filter in the tool
Throughout the tool, you can now find a search filter on the top of the screen. In this filter, you can look for products with, for example, a brand name or MPN code. Clicking on a product instantly gives you the product details in a popup throughout the whole application.
NOTE: All products in the search filter are products that are included in the product list.
NEW: Upload search volumes in a data set
It was already possible to monitor your products in the search rankings on marketplaces. But did you know you can also add search volumes to your data?
This means you can now see instantly how many people search for keywords you rank on in the search results.
Find out more in our help center.
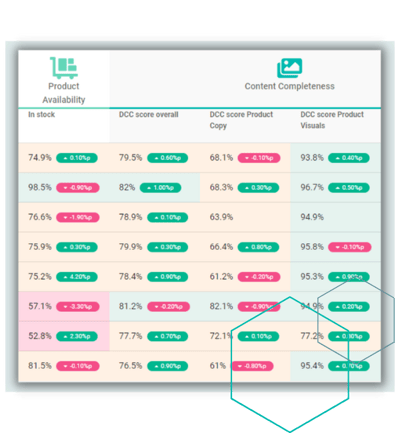
.png?width=1200&height=628&name=LinkedIn%202022%20(24).png)
NEW: Create DCC-score versions
Did you know it is possible to create multiple versions of the DCC score and compare them? In the side-by-side comparison, you can check if a new version of the DCC score adds value before actually activating the version.
Find out more about creating and using different DCC versions in our help center.
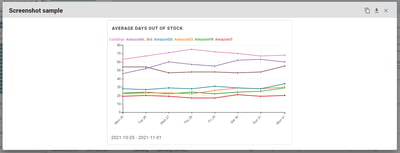
NEW: Compare date ranges in performance overviews
In performance overview widgets, you can compare date ranges. The comparison shows you how product performances on the digital shelf are evolving. Tip: Export the table with date range comparison as an image, and paste it into your monthly reports.
Find how to select and compare date ranges in our help center.
NEW: Display promotion details in table widgets
Before, promotion details were only visible in the product details. Now you can visualize them in a table widget.
For more information, contact your customer success manager.
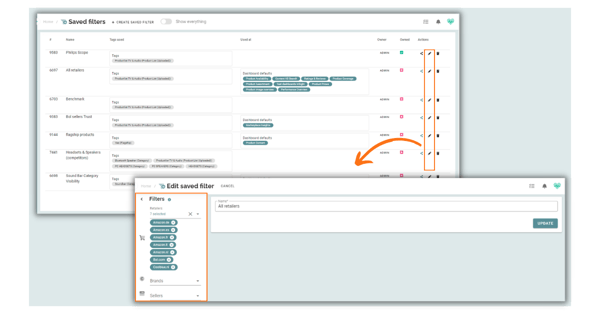
.png?width=600&name=Releases%20(72).png)
NEW: Edit saved filters in the module
In the saved filters overview, you can edit the name and the applied filter settings in the saved filter. You also in what dashboards it is used.
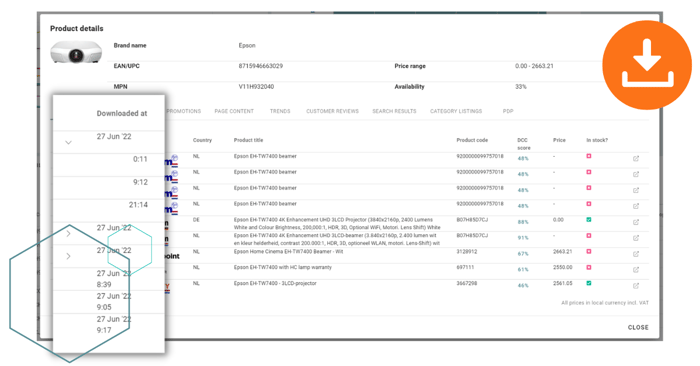
NEW: See instantly when a SKU has been downloaded
In the product details of a specific SKU, you can now see when the SKU has been downloaded.
Simply click on the 'I' icon of a SKU and find out when it was last downloaded!
.svg)
When you upgraded to scraping multiple times a day, you will see the times at which we scraped your products per day. Contact your customer success manager for more information about scraping multiple times a day.
NEW: Set a ribbon as default
Same as the possibility to set saved filters, it is now possible to set a default setting on a ribbon. You can find a ribbon in the 'Visibility' dashboard and the 'Marketplaces Insights' dashboard.
You can save a ribbon as your personal default, or as the dashboard default.
.svg)
NEW: Hide/show entities without results in the visibility dashboard
In the visibility dashboard, it is possible to hide or show entities without results. This could be useful for new (category) pages and keywords that have not been indexed yet. This function allows you to see your visibility on those category pages and keywords over time.
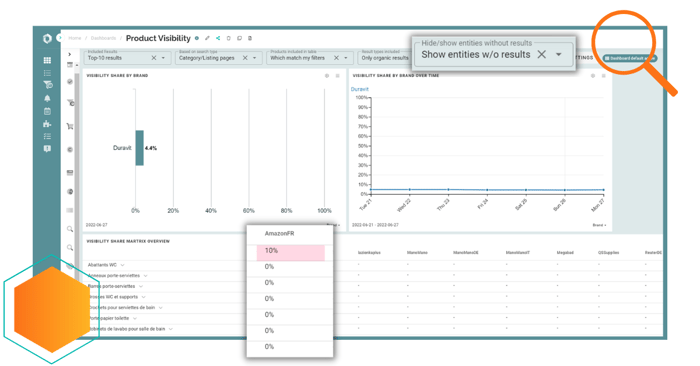
Find out more about how to use the visibility dashboard in our help center.
NEW: Use 'Product List Tags' as a dimension in widgets
You can now use tags from your product list as an override dimension in widgets! The functionality is now visible in performance overviews, line charts, and bar charts.
With this feature, you can create specific widgets that show deeper analyses. For example, you can create a dashboard with widgets that give you information per product segment.
.svg)
NOTE: the functionality can be used with all metrics, except for:
- Listing completeness
- Buy-box metrics
- Brand share metrics
Visit our help center to find out how you override widget settings.
NEW: Banner tracking
It is now possible to track banners on keywords and category pages on retailers We monitor the banner position, the brand behind the banner, and the target URL.
NOTE: This feature needs to be unlocked per retailer. Contact your customer success manager for more information!
![]()
We want your feedback!
We are still developing the 'Banner tracking'. Let us know your thoughts, tips, or suggestions via e-mail!
NEW: Possibility to bundle alerts
Before, you received alerts when a specified condition is met. Now, you can bundle all your alerts to receive them once a week, and get an overview of the times a certain threshold is hit.
Simply create your alerts and schedule them on a specific day. Go to our Help Center to find out how you can create alerts.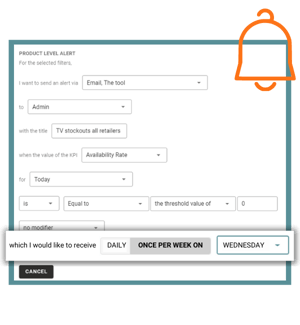
NEW: Generate PDFs from dashboards
It was already possible to export data from a widget in Excel or CSV format, or as an image. Now, you can generate a PDF file from a dashboard. Find out here how you can download your dashboards as a PDF.
The option to schedule a PDF download will be available soon.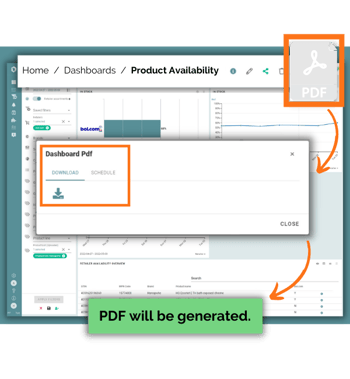
NEW: Image labels in the 'Product Image Overview' dashboard
The 'Product Image Overview' dashboard can show 3 image labels at this moment:
- Product image
- Usage image
- Logo image

The 'Show Image Labels' button ![]() is always visible, but Image Labels is an extra module that needs to be activated per retailer. Email support@sitelucent.com or contact your customer success manager for more information about the costs.
is always visible, but Image Labels is an extra module that needs to be activated per retailer. Email support@sitelucent.com or contact your customer success manager for more information about the costs.
NOTE: The image labels are still in progress. If you have any suggestions, send us an email.
NEW: 'Product details' show more product page elements
We added new elements to the product details.
- Promotions: this element needs to be configured per retailer, please contact your customer success manager if you want to add 'Promotions' to your product details.
.svg)
- Page content: the most important information found on product detail pages is displayed in this tab.
NOTE: At the top, you see product data from product lists; page content is what we see and find on the product detail pages..svg)
- Reviews: before, reviews could be found under de 'product details' tab. Now, reviews have their own tab.
NOTE: only reviews on the first page are visible in the tab..svg)
IMPROVED: Add due date to tasks
.svg)
New: Retailer configuration
Do you want to add new search keywords to one of your retailers? You now do this via our 'Retailer configuration'!
Retailer configuration is one overview where you can manage search keywords, search categories, and your product mapping.
.png?width=500&name=Releases%20(1).png)
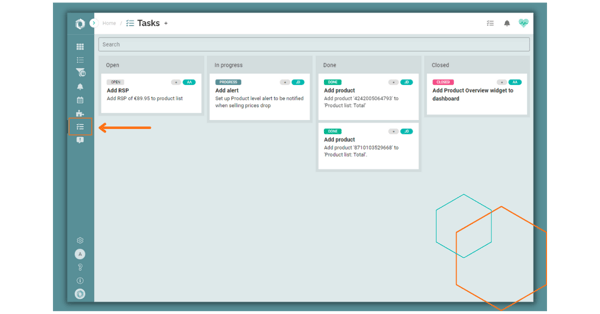
NEW: Task Module
It is now possible to organize tasks for you and your team within SiteLucent. Check out here how it works!
To add more functionalities to the in-app 'task organizer,' we need your help! Do you have suggestions or functionalities you would like to see? Let us know by sending an e-mail to support@sitelucent.com.
IMPROVED: Line breaks possible in free text widgets
We recently introduced free text widgets. A minor update makes line breaks possible to get your message across.
.png?width=600&name=Ontwerp%20zonder%20titel%20(10).png)
NEW: Marketplaces Insights Dashboard
At the top, a new filter menu allows you to switch between 'all offers' and 'winning offers.' This way, you can uncover insights into buy-box wins and losses and (3P)sellers. Marketplaces won't have any secrets for you!
Email support@sitelucent.com if you want to add this dashboard to your account! Please also mention in the email which marketplaces you want to have configured.
.png?width=600&name=Blog%20Images%201200628%20(17).png)
Measure bullet points on PDPs in the DCC Score
You can measure many attributes in the DCC score. We've added one more attribute: bullet points on a Product detail Page!
Bullet points are important since they should highlight what's most important for the customer to know! Measure if bullet points are present on a Product Detail Page and if keywords, product dimensions, or other information are correct.
.png?width=500&name=Release%20January%20(4).png)
Hide & Fix columns in tables and product lists
Keeping an overview in extensive tables and lists can be challenging, especially when working on a small screen.
We made it a bit easier: Hide and fix columns and fix headers to only display the information you need.
.png?width=500&name=Release%20January%20(1).png)
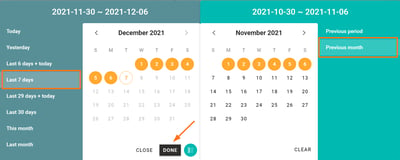
Compare data from 2 time periods
Curious whether your in-stock rate improved since your supply chain team uses out-of-stock alerts? Or do you want to quickly compare this month's visibility share to the previous month?
SiteLucent provides a way to compare date ranges in KPI-, line- and bar chart widgets.
Read here how it works!
Export to image option for widgets
Exporting widget data to a CSV or Excel file was already a possibility, but now you can also export your widget as an image.
Read here how it works!
Track Retailer-Specific Selling Prices (RSP)
Every retailer is different, as are the price agreements you make with them. It can be a hassle but, we've got your back by determining which Retail Sales Price (RSP) is applicable at which time, based on the retailer and associated country, currency, or language.
Read here how to set it up!
Organic or Sponsored Search Placement?
You can lift your brands' products to the top of retail search results by driving organic or paid search— zoom in to organic and sponsored retail search placements with our newest feature!
You can read all about it in this help centre article.
UX optimization: Add product descriptions in tables
We've added a 'read more' option to unfold a complete product description in a table. This way, you have a more compact view initially. Watch the video below to see how it looks!
When you export the table data to an Excel or CSV file, you will see the full product descriptions.
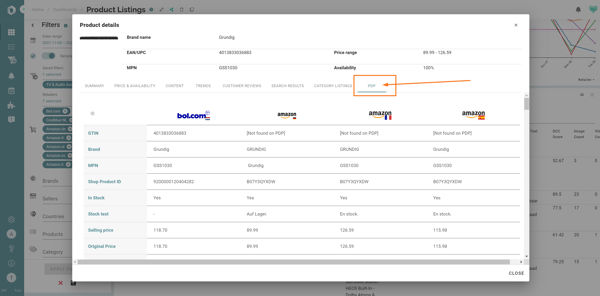
PDP tab product details
Monitor all textual data on your PDP in one overview and compare up to 4 retailers.
Scheduled export updates include filters now
What's more efficient than automated reports that deliver digital shelf data to the right people, at the right moment? Read more about (editing) scheduled data exports in this article.
Create Text Widgets
Do you want to make your dashboards even more stunning? Create text widgets!
You can now add free text widgets that allow you to add a target (for in-stock rates or DCC scores) for your team to a dashboard or any other valuable information.
Create your own performance overview
It is now possible to create and edit a performance overview widget.
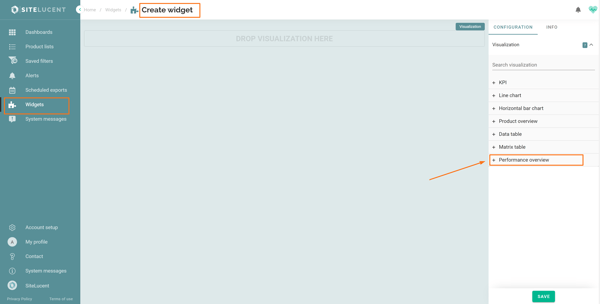
Make changes to the default:
- Column groups --> topics
- Icons with Dashboard click-through
- Columns --> Metrics or KPIs
- Conditional coloring/thresholds
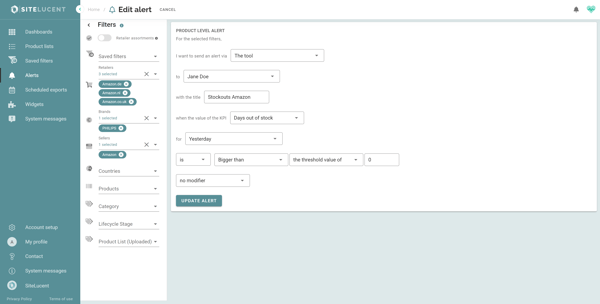
Alerts on product-level
You could already set up alerts at the KPI level. It is now also possible to set up alerts on product level. You then receive an alert when the specified condition for at least one individual product is met.
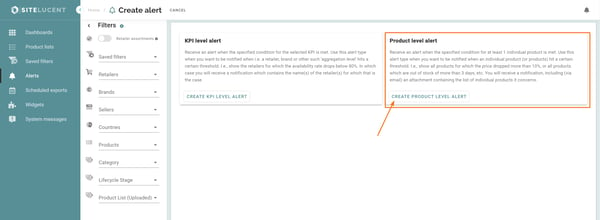
Use this alert type when you want to be notified when an individual product (or products) hit a certain threshold.
For instance:
- Show products for which the price dropped more than 10%
- Show products that are out of stock for more than one day.
- Show products that dropped out of the top-10 search results on a retailer site for a specified keyword.
You will receive an in-app notification (and email), including an attachment containing the list of individual products it concerns.
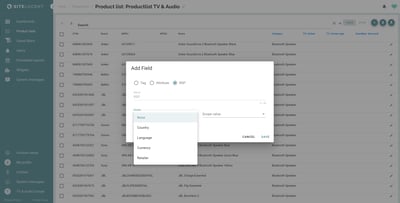
Language-, Country- and Currency-Specific Attributes
You could already fill out Attributes in Column Z - AS in a product list.
What are attributes for?
- Add attributes such as color, weight, size and main keywords to identify gaps and inconsistencies in product content.
- Add the attribute 'RSP' (Recommended Retail Price) to measure price deviations.
What's new?
You can additionally add language-, country- and currency-specific values as attributes to a product list. For instance, in the case of the RSP:
- Language-country combination: RSP [ISO language 2-letter code]. e.g. RSP [nl_NL]
- Country: RSP [ISO country code]. e.g. RSP [GB]
- Currency: RSP [ISO currency code]. e.g. RSP [SEK]
In Belgium, both the Dutch and French languages are spoken. In that case, you can add a column with the title: RSP [nl_BE] and a column with the title: RSP [fr_BE] if the values differ per language.
Our tool determines which value is applicable at which time, based on the retailer and associated country, currency and language. The order applies as above. 'Fallback' is the default (without addition -> RSP itself).
If more than one may apply, the range is displayed; e.g. if multiple country-specific RSPs are specified for 1 product (and in combination with currency and languages), and the retailers are displayed NEXT to each other. that only applies in the "Pricing overview" widget. In all different situations, only one applies.
Track Google Shopping listings
You can now track Google Shopping Offers in the Netherlands.
What you can monitor on Google Shopping NL:
- Seller (buy box winner) & possible other offers
- Article price
- Total price (including sending costs)
- Availability
Get in touch with sales if you have questions about or are interested in monitoring Google Shopping offers.
XLSX download option
In addition to the already existing option to download data in CSV, there is also the option to download data in an XSLX file.